Copyright View the Space, Inc. 2025

METHODOLOGY


VTS Office
Demand Index
(VODI)

Quarterly Report
Get a pulse on what’s happening in the market today.
Explore nationwide trends
Annual demand gains on the back of a quarterly deceleration
NATIONAL

KEY TAKEAWAYS
NATIONAL TRENDS
LOCAL TRENDS
METHODOLOGY
COMPANY

National
Local
KEY TAKEAWAYS FROM THIS REPORT
NEXT
VTS Office
Demand Index
(VODI)
QUARTERLY REPORT
October 2025
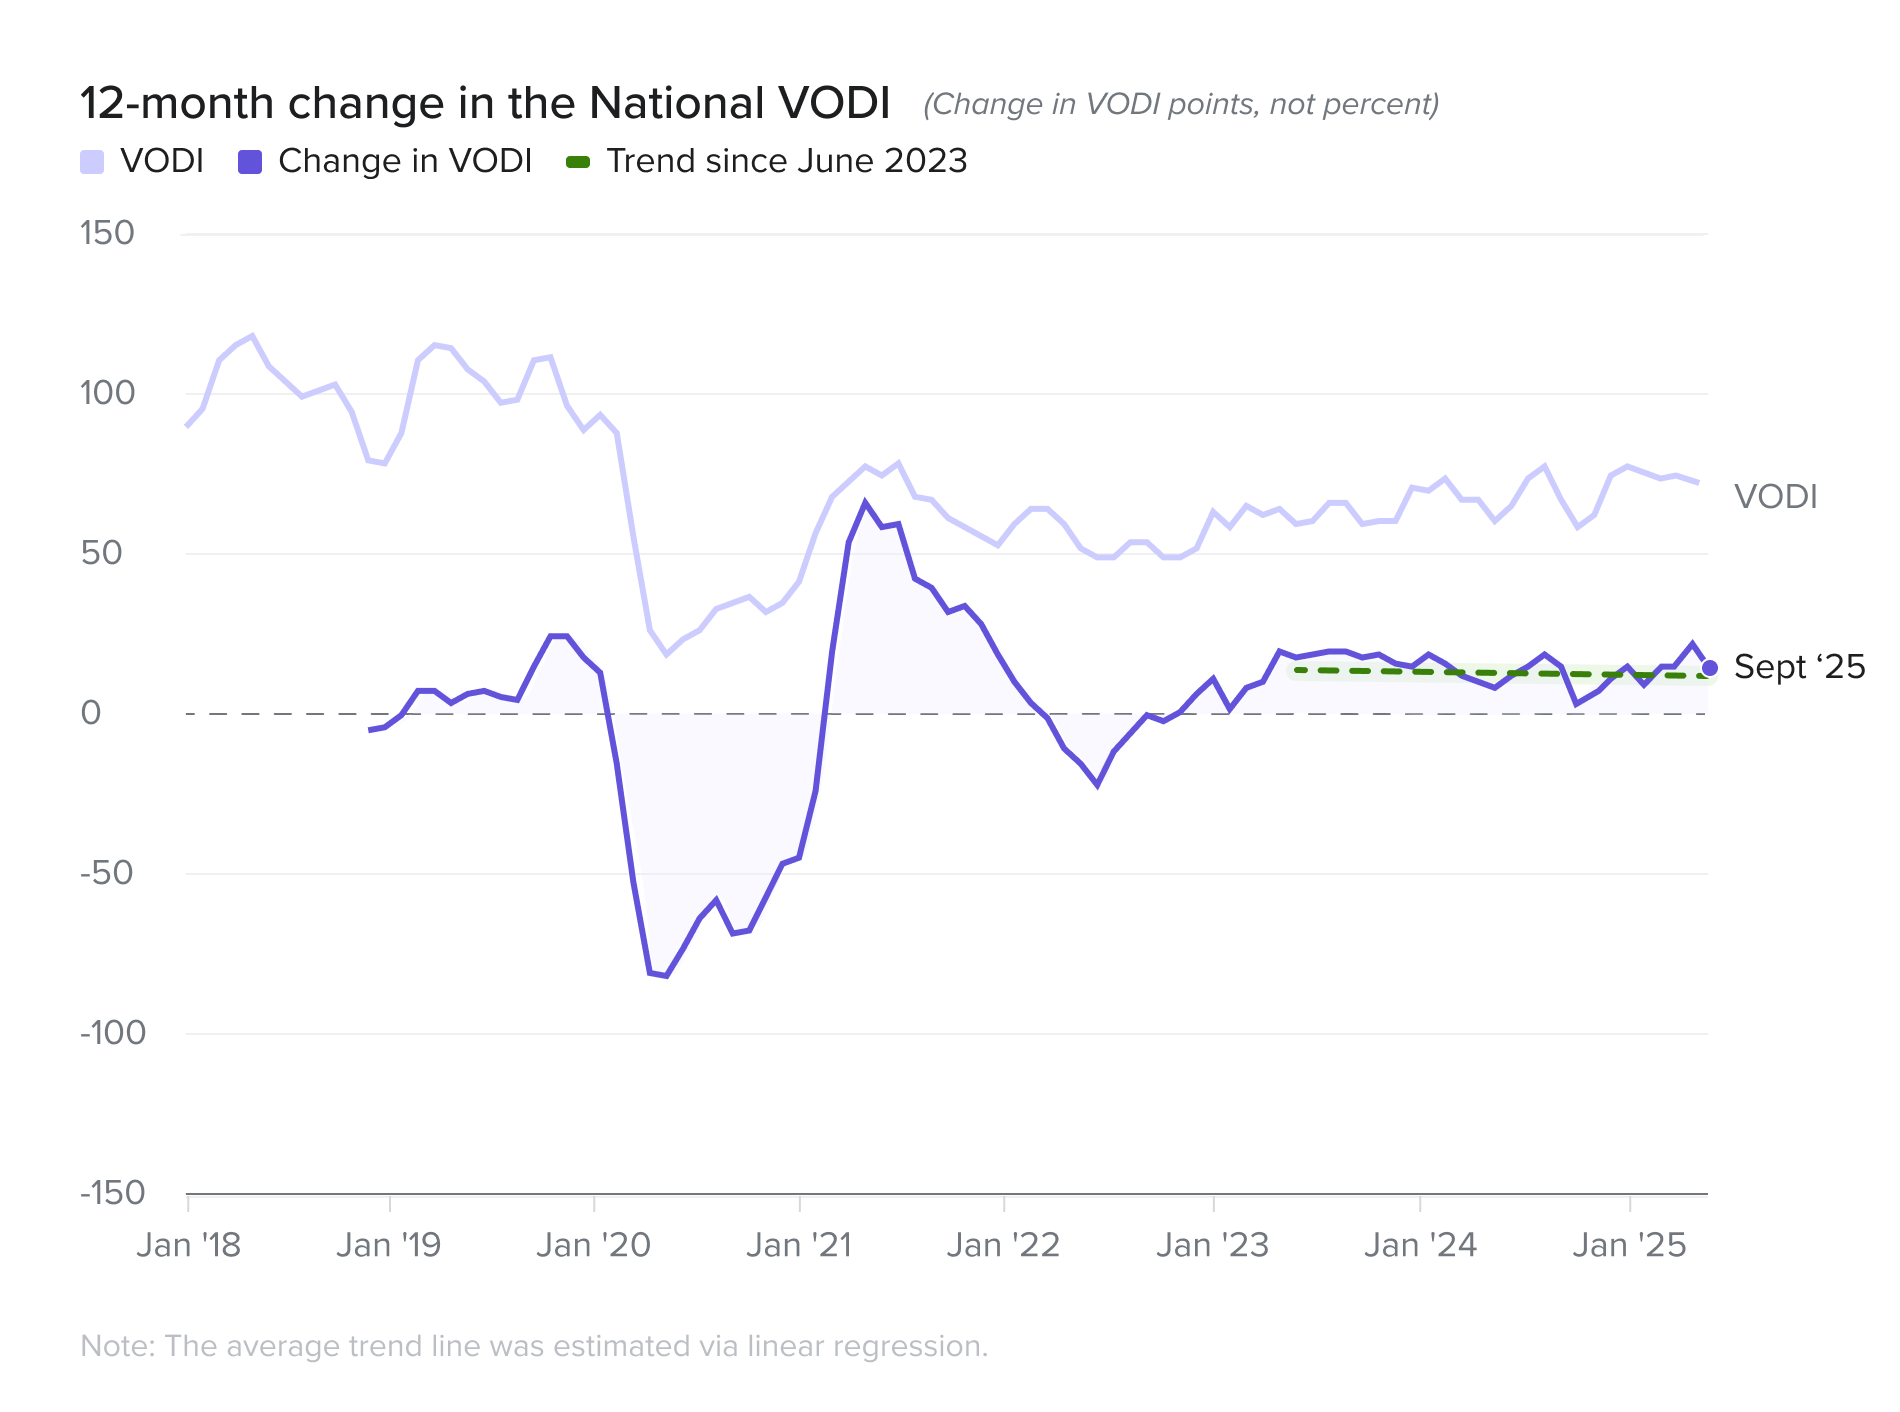
The VODI softened in Q1 2025. Although the index ended the quarter at 68—up a modest 4.6% from a year earlier—that figure masks declines in January and February that ended a 20-month streak of year-over-year growth.
NATIONAL
The first quarter of 2025, however, showed uneven movement:
SEE MORE NATIONAL TRENDS
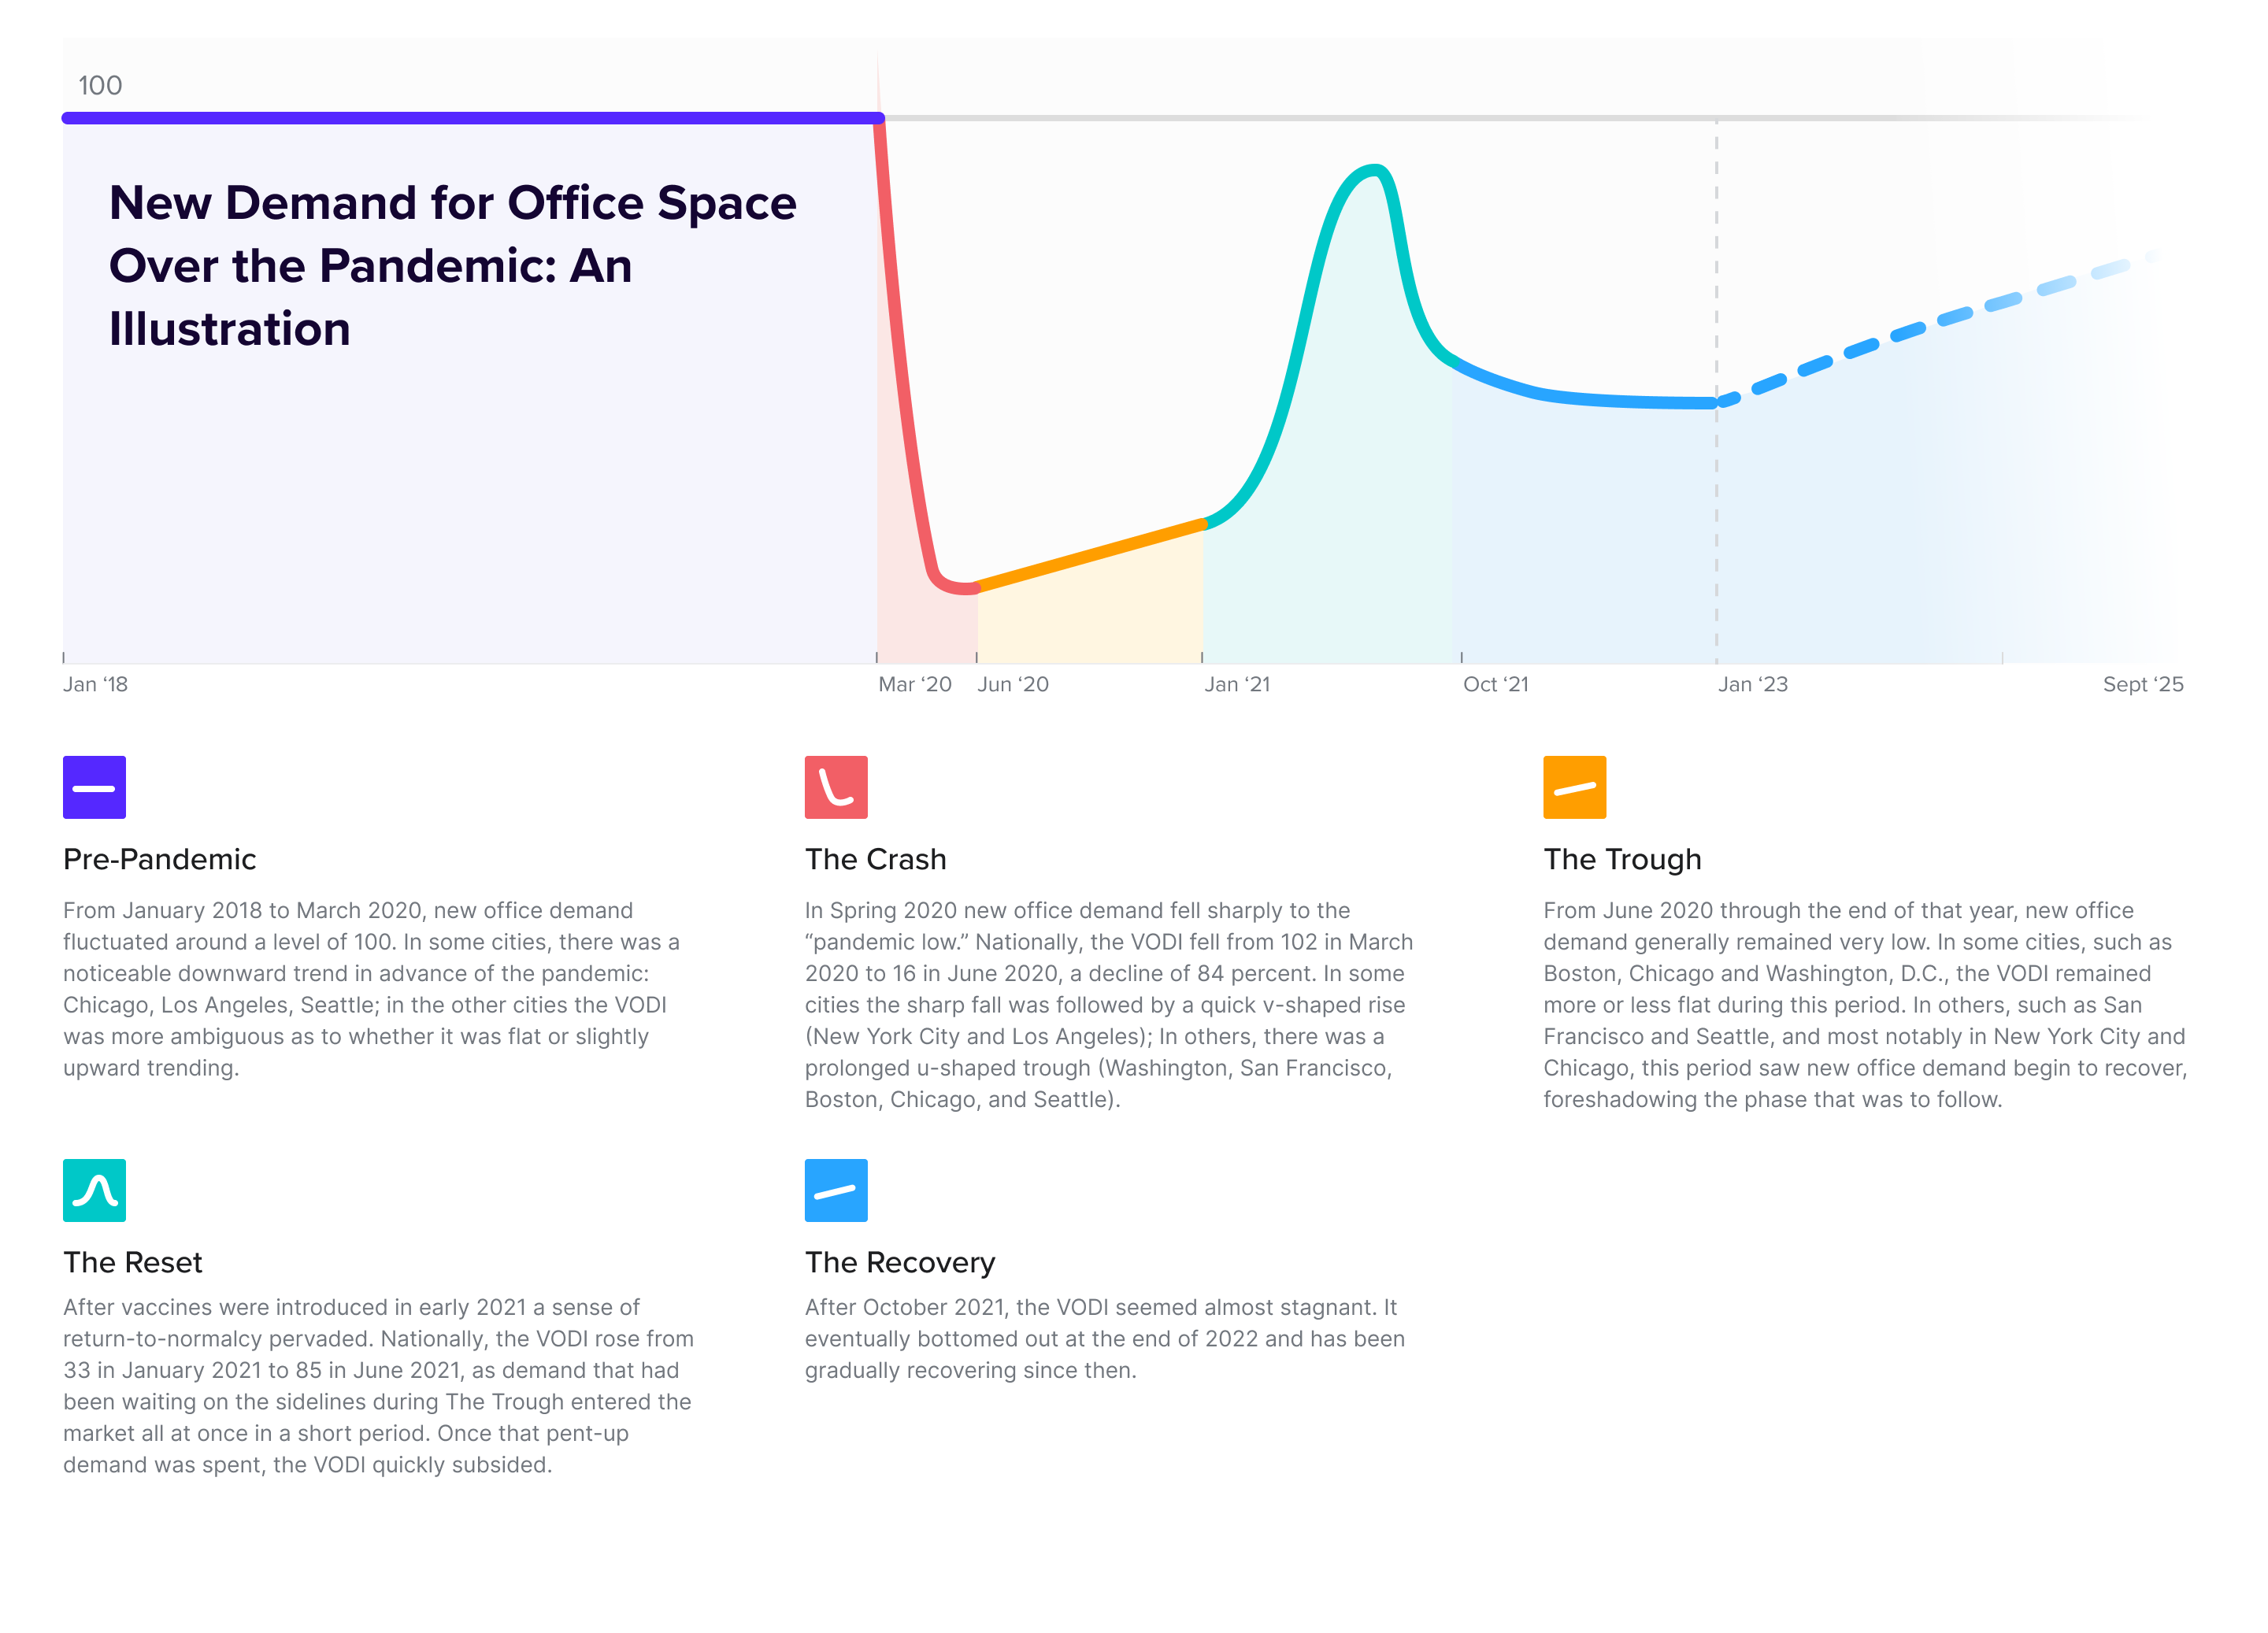
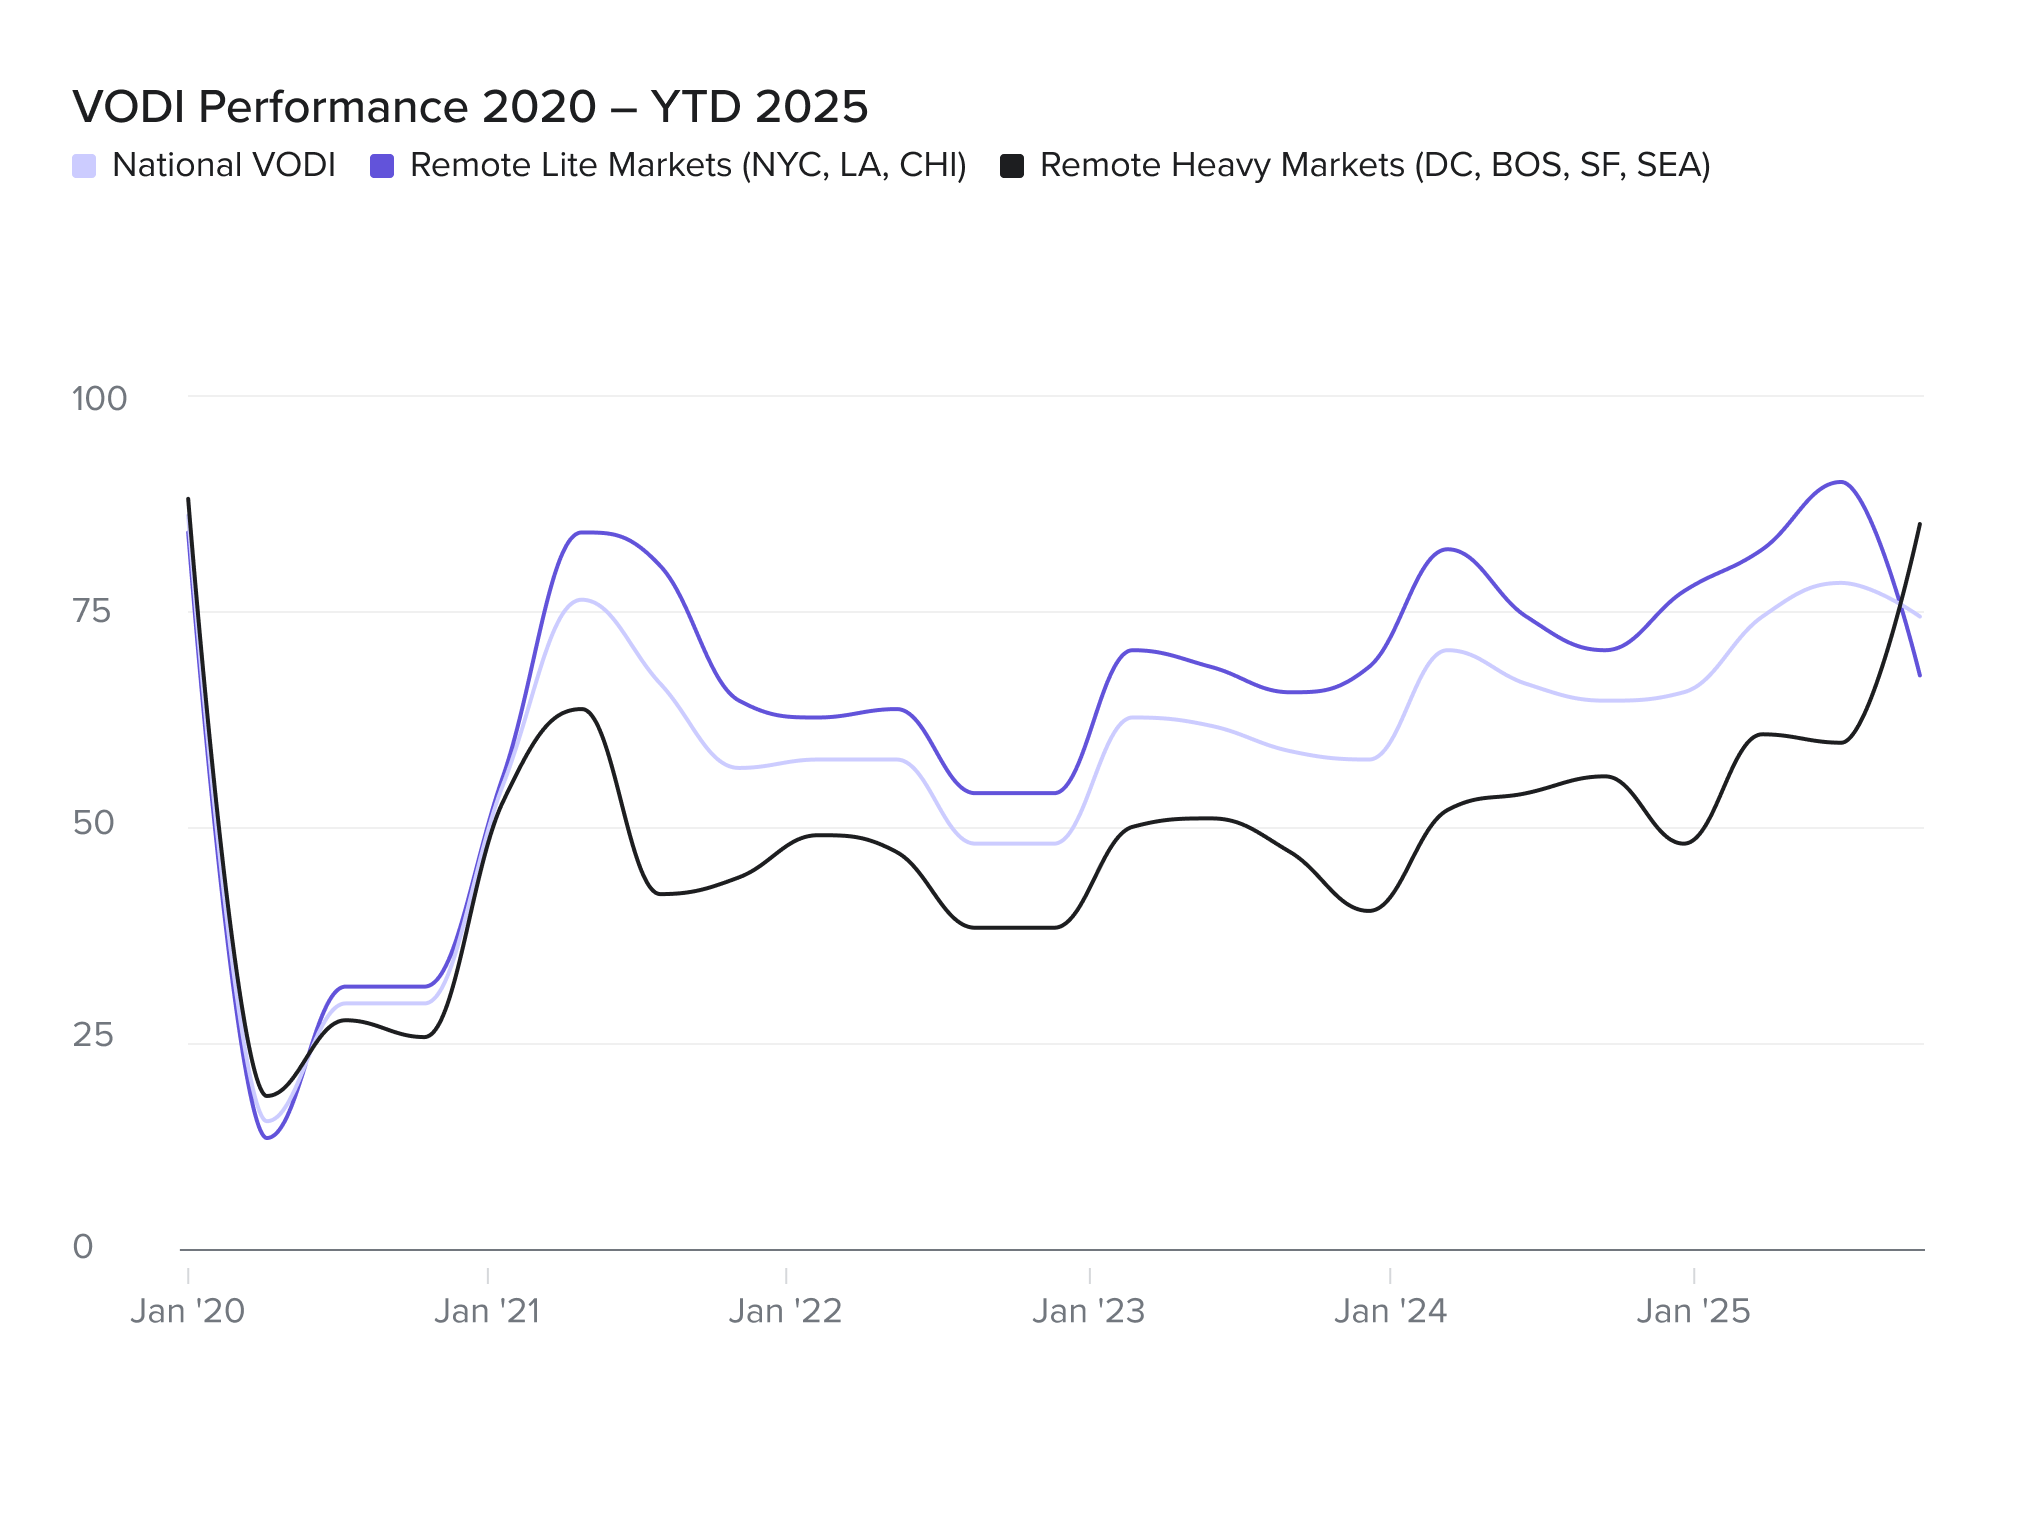
From January 2018 to March 2020, new office demand fluctuated around a level of 100. In some cities, there was a noticeable downward trend in advance of the pandemic: Chicago, Los Angeles, Seattle; in the other cities the VODI was more ambiguous as to whether it was flat or slightly upward trending.
Pre-Pandemic
In Spring 2020 new office demand fell sharply to the “pandemic low.” Nationally, the VODI fell from 102 in March 2020 to 16 in June 2020, a decline of 84 percent. In some cities the sharp fall was followed by a quick v-shaped rise (New York City and Los Angeles); In others, there was a prolonged u-shaped trough (Washington, D.C., San Francisco, Boston, Chicago, and Seattle).
The Crash
From June 2020 through the end of that year, new office demand generally remained very low. In some cities, such as Boston, Chicago, and Washington, D.C., the VODI remained more or less flat during this period. In others, such as San Francisco and Seattle, and most notably in New York City and Chicago, this period saw new office demand begin to recover, foreshadowing the phase that was to follow.
The Trough
After vaccines were introduced in early 2021 a sense of return-to-normalcy pervaded. Nationally, the VODI rose from 33 in January 2021 to 85 in June 2021, as demand that had been waiting on the sidelines during The Trough entered the market all at once in a short period. Once that pent-up demand was spent, the VODI quickly subsided from 87 in August 2021 to 61 in October 2021. Although cities whose economies are more remote work-friendly exhibited substantially lower levels of new office demand, all cities experienced a reset.
The Reset
Since October 2021 the VODI has been seemingly stagnant. It trended downward slightly in the earlier part of the period, and bottomed out in late-2022 and early-2023. Since then, it has slowly begun gaining new momentum.
The Thawing
LOCAL
Read more local VODI trends
Get a pulse on what’s happening in the market today.
Copyright View the Space, Inc. 2025
BACK TO TOP
METHODOLOGY


National
Local
KEY TAKEAWAYS FROM THIS REPORT
Tech-centric powerhouses led the charge. San Francisco’s VODI continued its climb with a 60 percent quarterly gain, fueled by an AI-driven boom and large tenant demand. Boston executed a reversal from its Q2 slump, with its VODI surging 85 percent as large requirements from the Tech and Legal sectors returned in force.
PREVIOUS

The nation’s office market entered a period of moderation in the third quarter of 2025. The national VTS Office Demand Index (VODI) ended the quarter at 72, a four percent decline from Q2 but still a robust 16 percent year-over-year increase. Annual progress continues but near-term momentum has stalled.
April 2025

This volatility is unfolding against a backdrop of powerful, opposing macroeconomic forces: a federal government shutdown that began on October 1 – injecting uncertainty and delaying release of key economic data, and a 25 basis point interest rate cut by the U.S. Federal Reserve, aimed at stimulating investment and job growth in a stalled labor market where the unemployment rate increased to 4.3 percent from June’s 4.1 percent, and any job gains in Q3 were revised downward.


Read more
Read more
Read more
Read more
Read more
Pre-Pandemic
The Reset
The Crash
The Recovery
The Trough

New demand for office space �over the pandemic: An illustration
Is demand �finally thawing?
From January 2018 to March 2020, new office demand fluctuated around a level of 100. In some cities, there was a noticeable downward trend in advance of the pandemic: Chicago, Los Angeles, Seattle; in the other cities the VODI was more ambiguous as to whether it was flat or slightly upward trending.
Pre-Pandemic


In Spring 2020 new office demand fell sharply to the “pandemic low.” Nationally, the VODI fell from 84 in March 2020 to 12 in June 2020, a decline of 86 percent. In some cities the sharp fall was followed by a quick v-shaped rise (New York City and Los Angeles); In others, there was a prolonged u-shaped trough (Washington, San Francisco, Boston, Chicago, and Seattle).
The Crash

From June 2020 through the end of that year, new office demand generally remained very low. In some cities, such as Boston, Chicago and Washington, D.C., the VODI remained more or less flat during this period. In others, such as San Francisco and Seattle, and most notably in New York City and Chicago, this period saw new office demand begin to recover, foreshadowing the phase that was to follow.
The Trough

After vaccines were introduced in early 2021 a sense of return-to-normalcy pervaded. Nationally, the VODI rose from 33 in January 2021 to 85 in June 2021, as demand that had been waiting on the sidelines during The Trough entered the market all at once in a short period. Once that pent-up demand was spent, the VODI quickly subsided.
The Reset

After October 2021, the VODI seemed almost stagnant. It eventually bottomed out at the end of 2022 and has been gradually recovering since then.
The Recovery


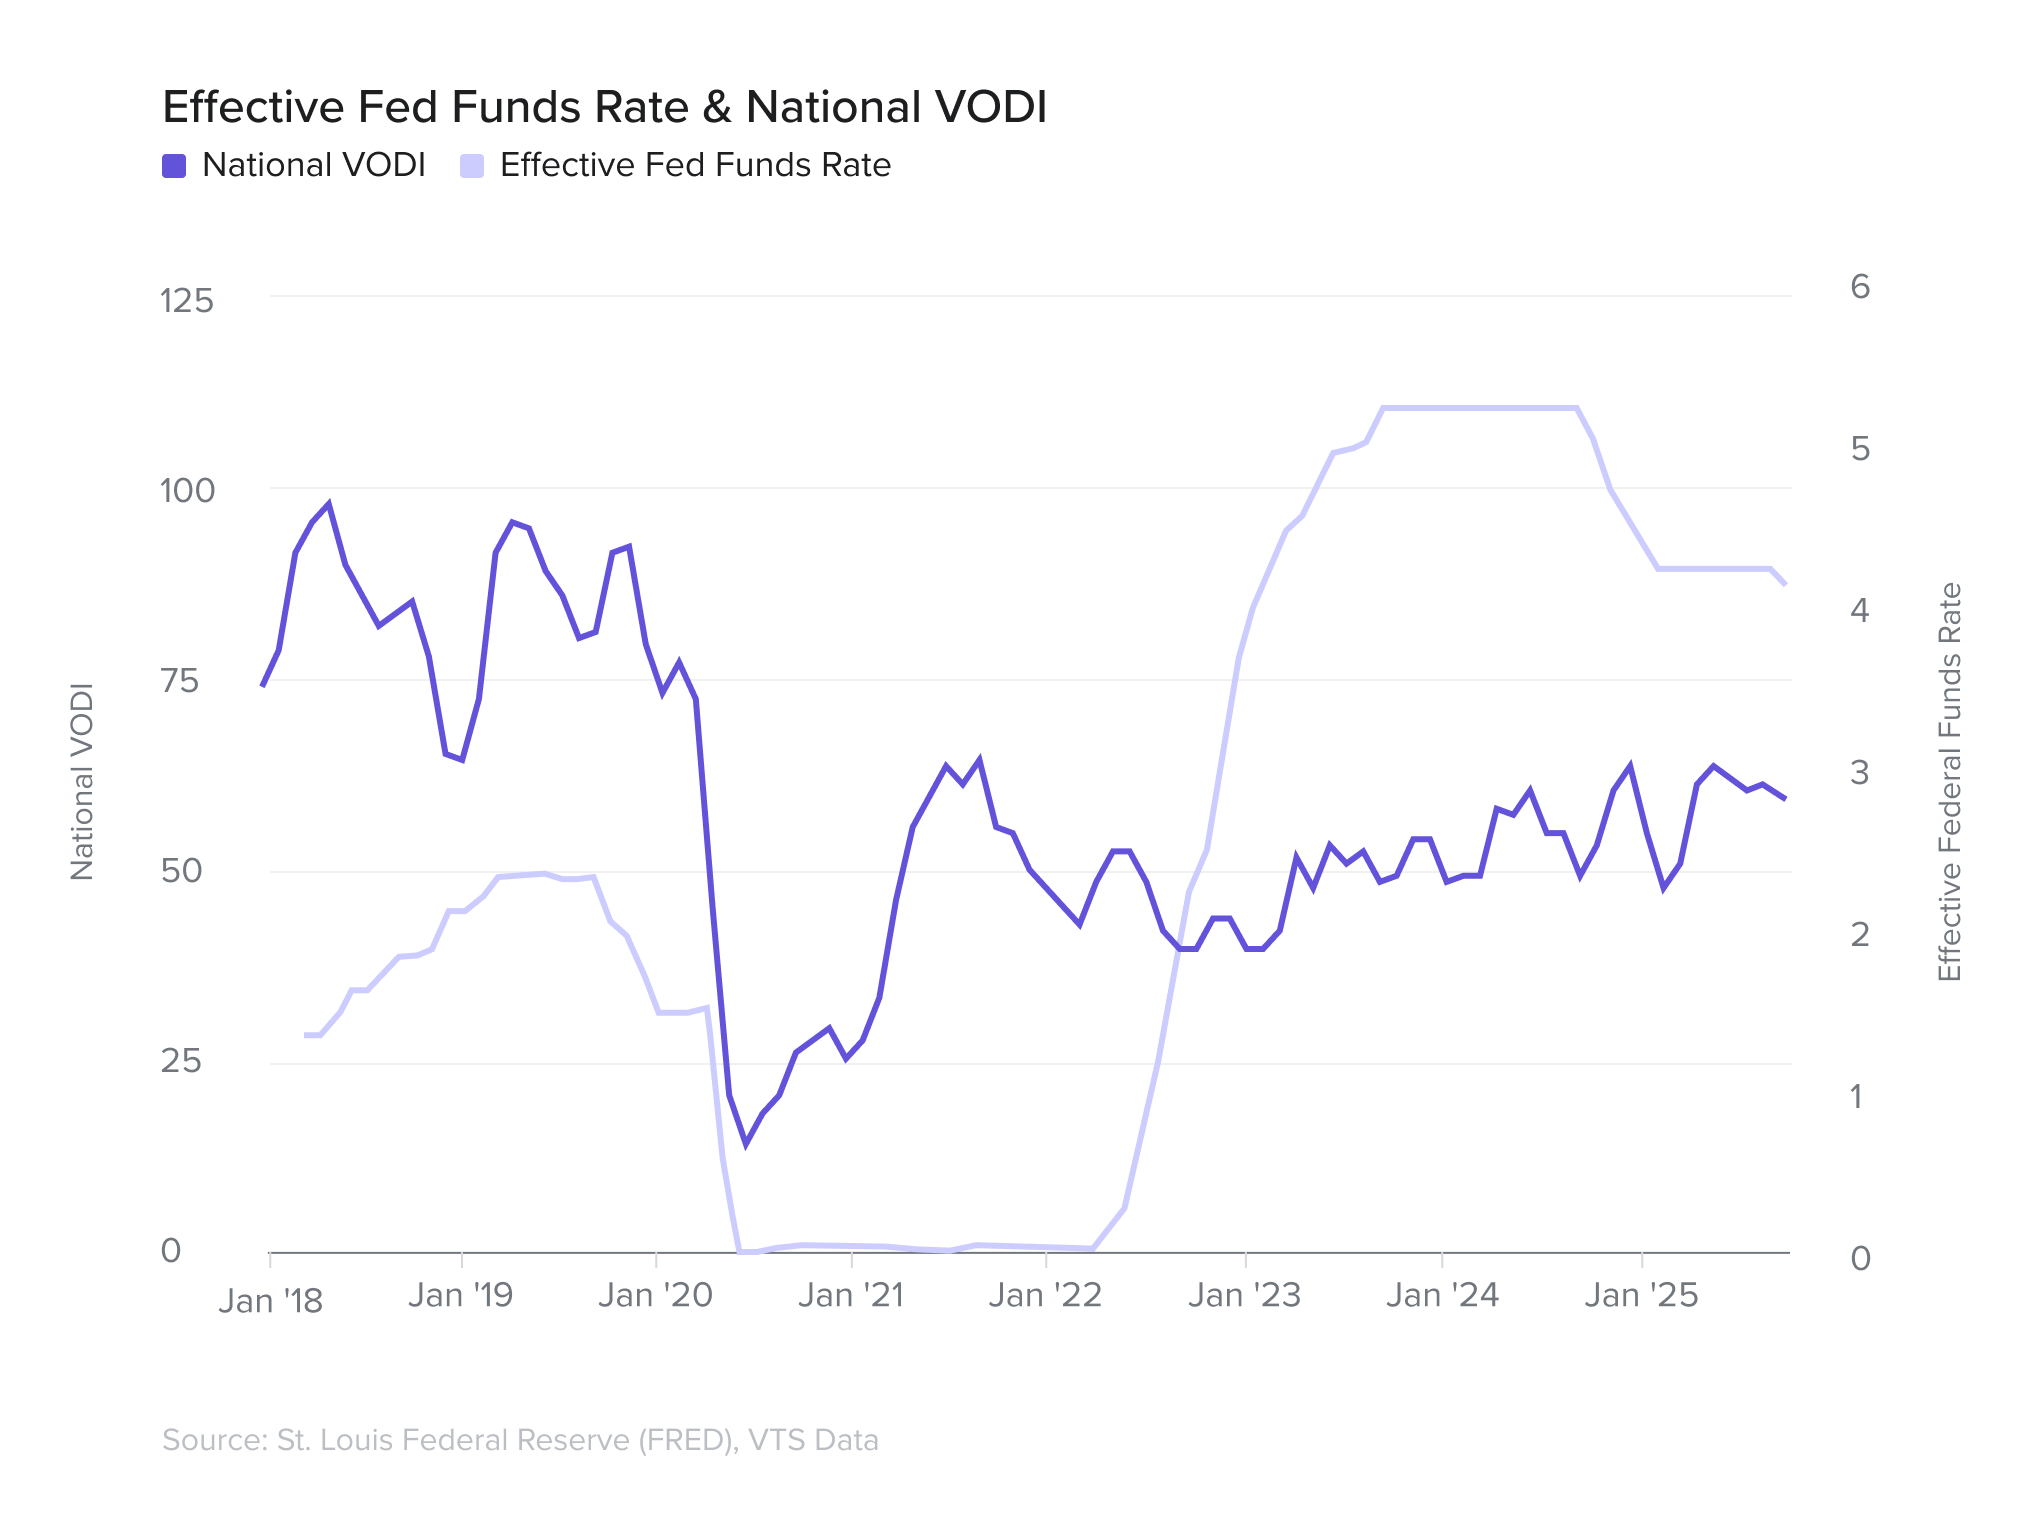
The market is currently caught between two recent powerful and opposing macroeconomic forces. The federal government shutdown, effective October 1, presents a significant headwind, immediately halting new federal leasing and imposing an "uncertainty tax" on the private sector that discourages long-term commitments. In direct contrast, the U.S. Federal Reserve's 25 basis point interest rate cut acts as a potential tailwind by reducing borrowing costs for working capital as firms ponder expanding. However, this stimulus is a double-edged sword, as rate cuts also signal the central bank's concern about underlying economic health, the ultimate driver of tenant demand. Notwithstanding, there is still an ongoing trade war which has negatively impacted business and consumer confidence. The market's trajectory will be defined by the tension between the shutdown's cooling effect on confidence and the rate cut's stimulus to capital markets.
�
Learn more about VTS Data
See VODI Methodology
Explore nationwide trends
The national VODI closed the year 16.4 percent higher than a year ago and 39.1 percent higher than two years ago.
At this pace of growth, it would take approximately four more years for the VODI to reach a level of 100 in December.
•
��•
Read more
Pre-Pandemic
Read more
The Crash
Read more
The Trough
Read more
The Reset
Read more
The Thawing
Could we be at
inflection point?
Jan '18
Mar '20
Jun '20
Oct '21
Jan '23
Jan '21
Mar '25
New demand for office space over the pandemic: An illustration
From January 2018 to March 2020, new office demand fluctuated around a level of 100. In some cities, there was a noticeable downward trend in advance of the pandemic: Chicago, Los Angeles, Seattle; in the other cities the VODI was more ambiguous as to whether it was flat or slightly upward trending.
Pre-Pandemic
In Spring 2020 new office demand fell sharply to the “pandemic low.” Nationally, the VODI fell from 84 in March 2020 to 12 in June 2020, a decline of 86 percent. In some cities the sharp fall was followed by a quick v-shaped rise (New York City and Los Angeles); In others, there was a prolonged u-shaped trough (Washington, San Francisco, Boston, Chicago, and Seattle).
The Crash
From June 2020 through the end of that year, new office demand generally remained very low. In some cities, such as Boston, Chicago, and Washington, D.C., the VODI remained more or less flat during this period. In others, such as San Francisco and Seattle, and most notably in New York City and Chicago, this period saw new office demand begin to recover, foreshadowing the phase that was to follow.
The Trough
After vaccines were introduced in early 2021 a sense of return-to-normalcy pervaded. Nationally, the VODI rose from 33 in January 2021 to 85 in June 2021, as demand that had been waiting on the sidelines during The Trough entered the market all at once in a short period. Once that pent-up demand was spent, the VODI quickly subsided from 87 in August 2021 to 61 in October 2021. Although cities whose economies are more remote work-friendly exhibited substantially lower levels of new office demand, all cities experienced a reset.
The Reset
Since October 2021 the VODI has been seemingly stagnant. It trended downward slightly in the earlier part of the period, and bottomed out in late-2022 and early-2023. Since then, it has slowly begun gaining new momentum.
The Thawing


The national VODI closed the year 16.4 percent higher than a year ago and 39.1 percent higher than two years ago.
At this pace of growth, it would take approximately four more years for the VODI to reach a level of 100 in December.
•
��•
In addition, recent gyrations in new U.S. trade policy have heightened economic uncertainty. Uncertainty typically prompts caution, leading employers to delay hiring and related commitments, such as signing new office leases.
While a cooling labor market normally weakens office demand, the current situation is more complex. We’re still in the midst of a broad return-to-office trend following the COVID-19 pandemic. As the labor market cools, employers gain bargaining power, enabling them to push for more on-site work, which helps offset the drag on office demand.
The sectoral mix of new office demand highlights this offsetting effect. The FIRE sector’s share of new office demand dropped sharply in Q1, falling from 31.9 percent of square footage in November 2024 to just 20.8 percent in March 2025. This sector tends to be more sensitive to shifts in financial conditions and was already among the most advanced in returning to the office, leaving less room for further on-site gains to counterbalance labor market weakness.
Explore nationwide trends
Read VODI impacts on local markets
See VODI Methodology


increase from a year ago
22.7%
WASHINGTON, D.C.
National
Explore nationwide trends
NEXT
The tech-driven powerhouses:�San Francisco, Boston, and Seattle
�
Markets in Focus
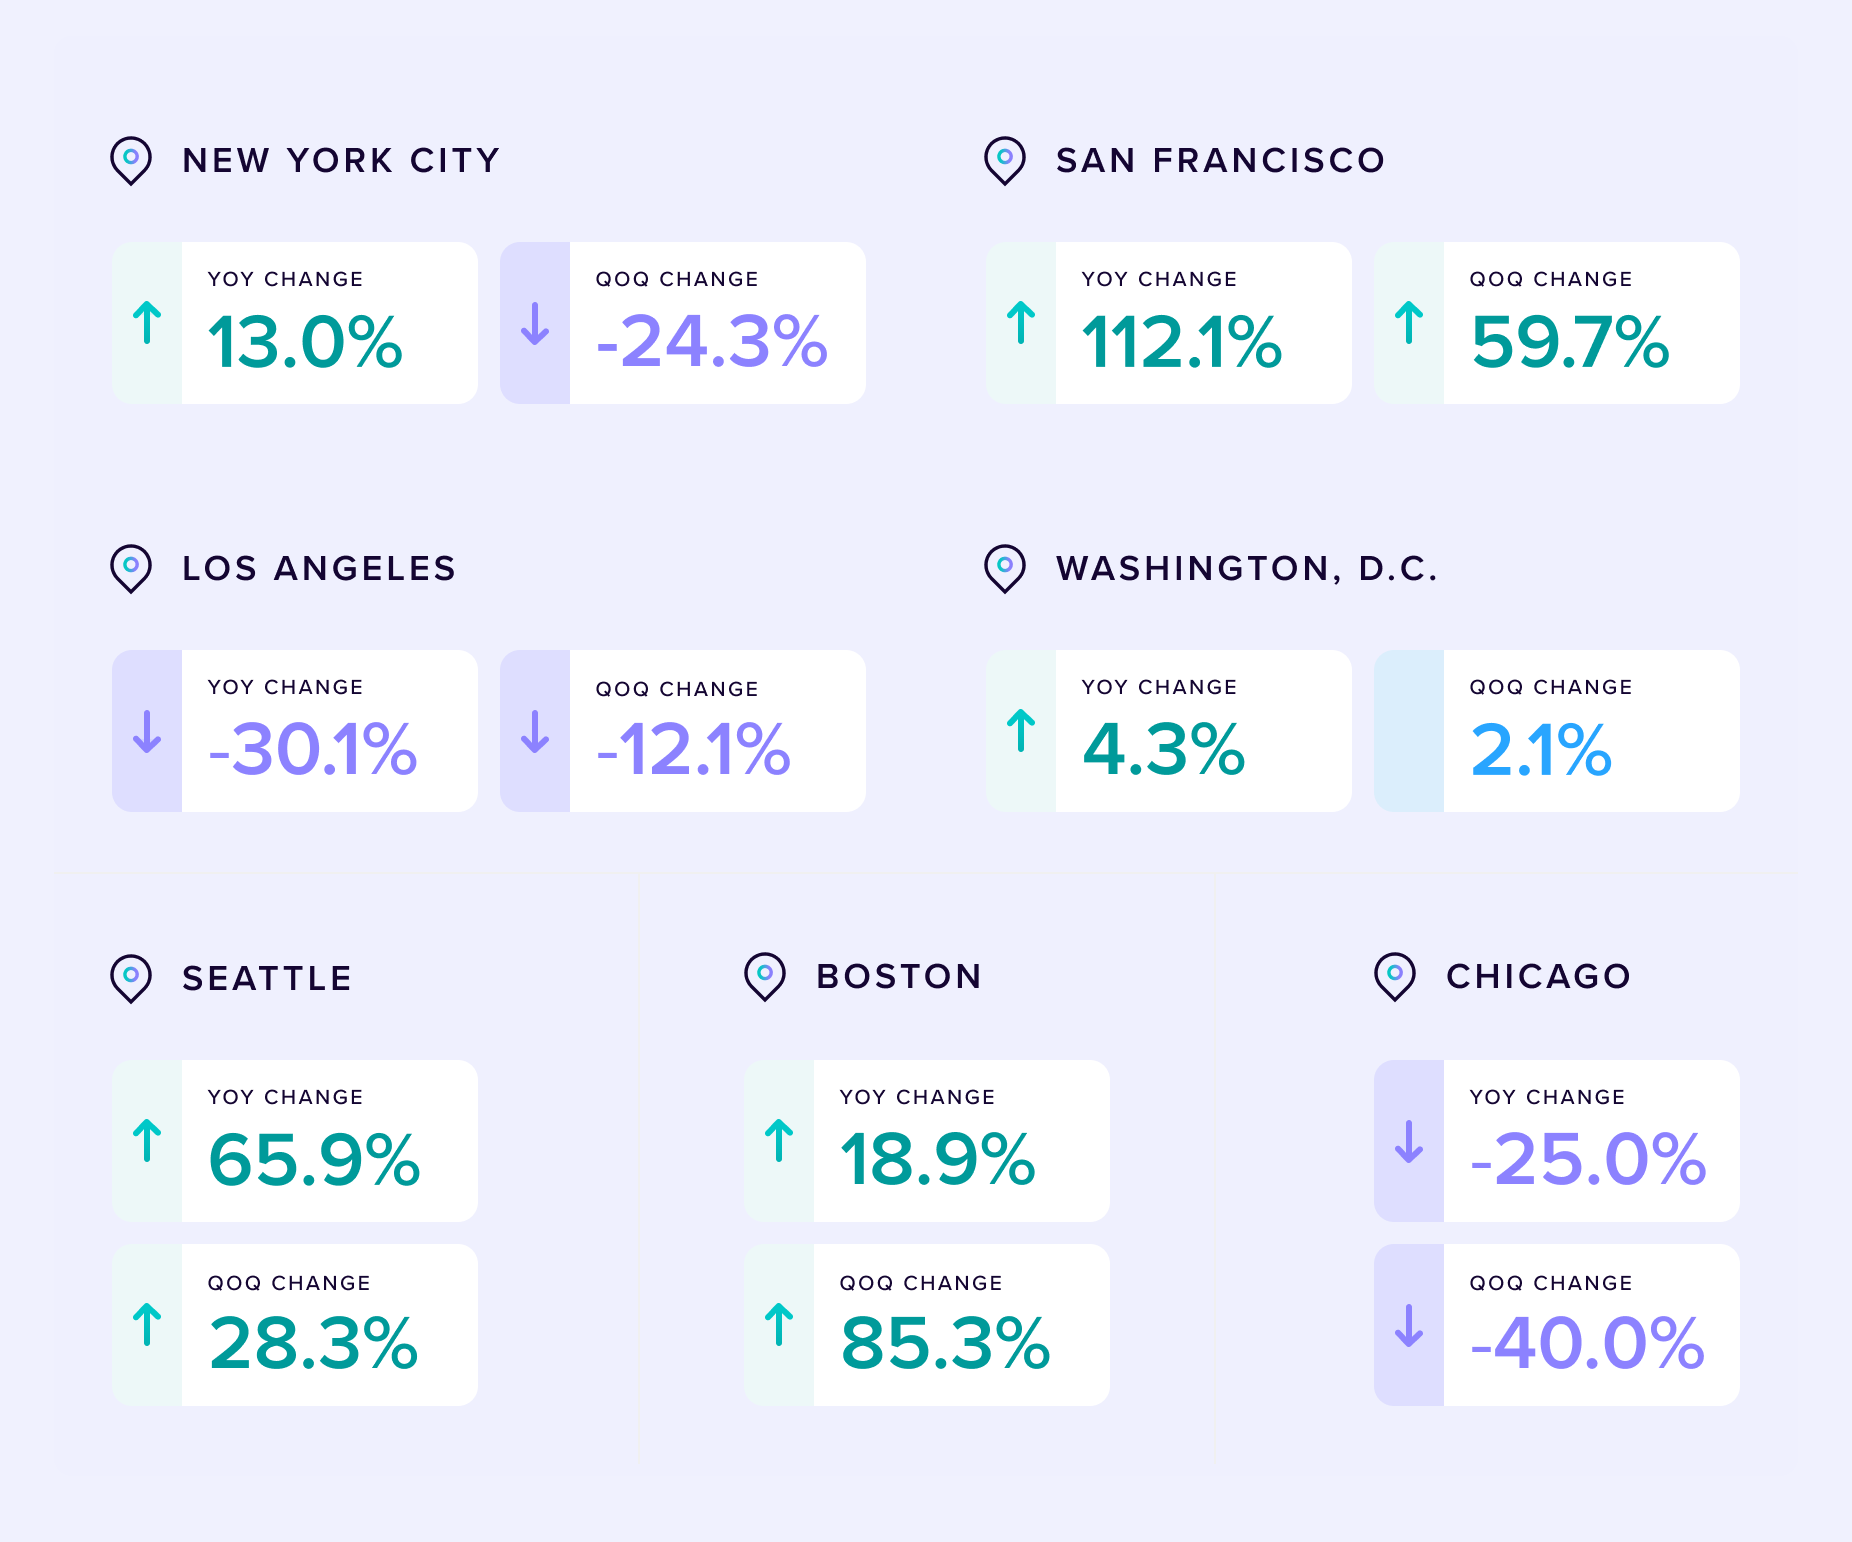
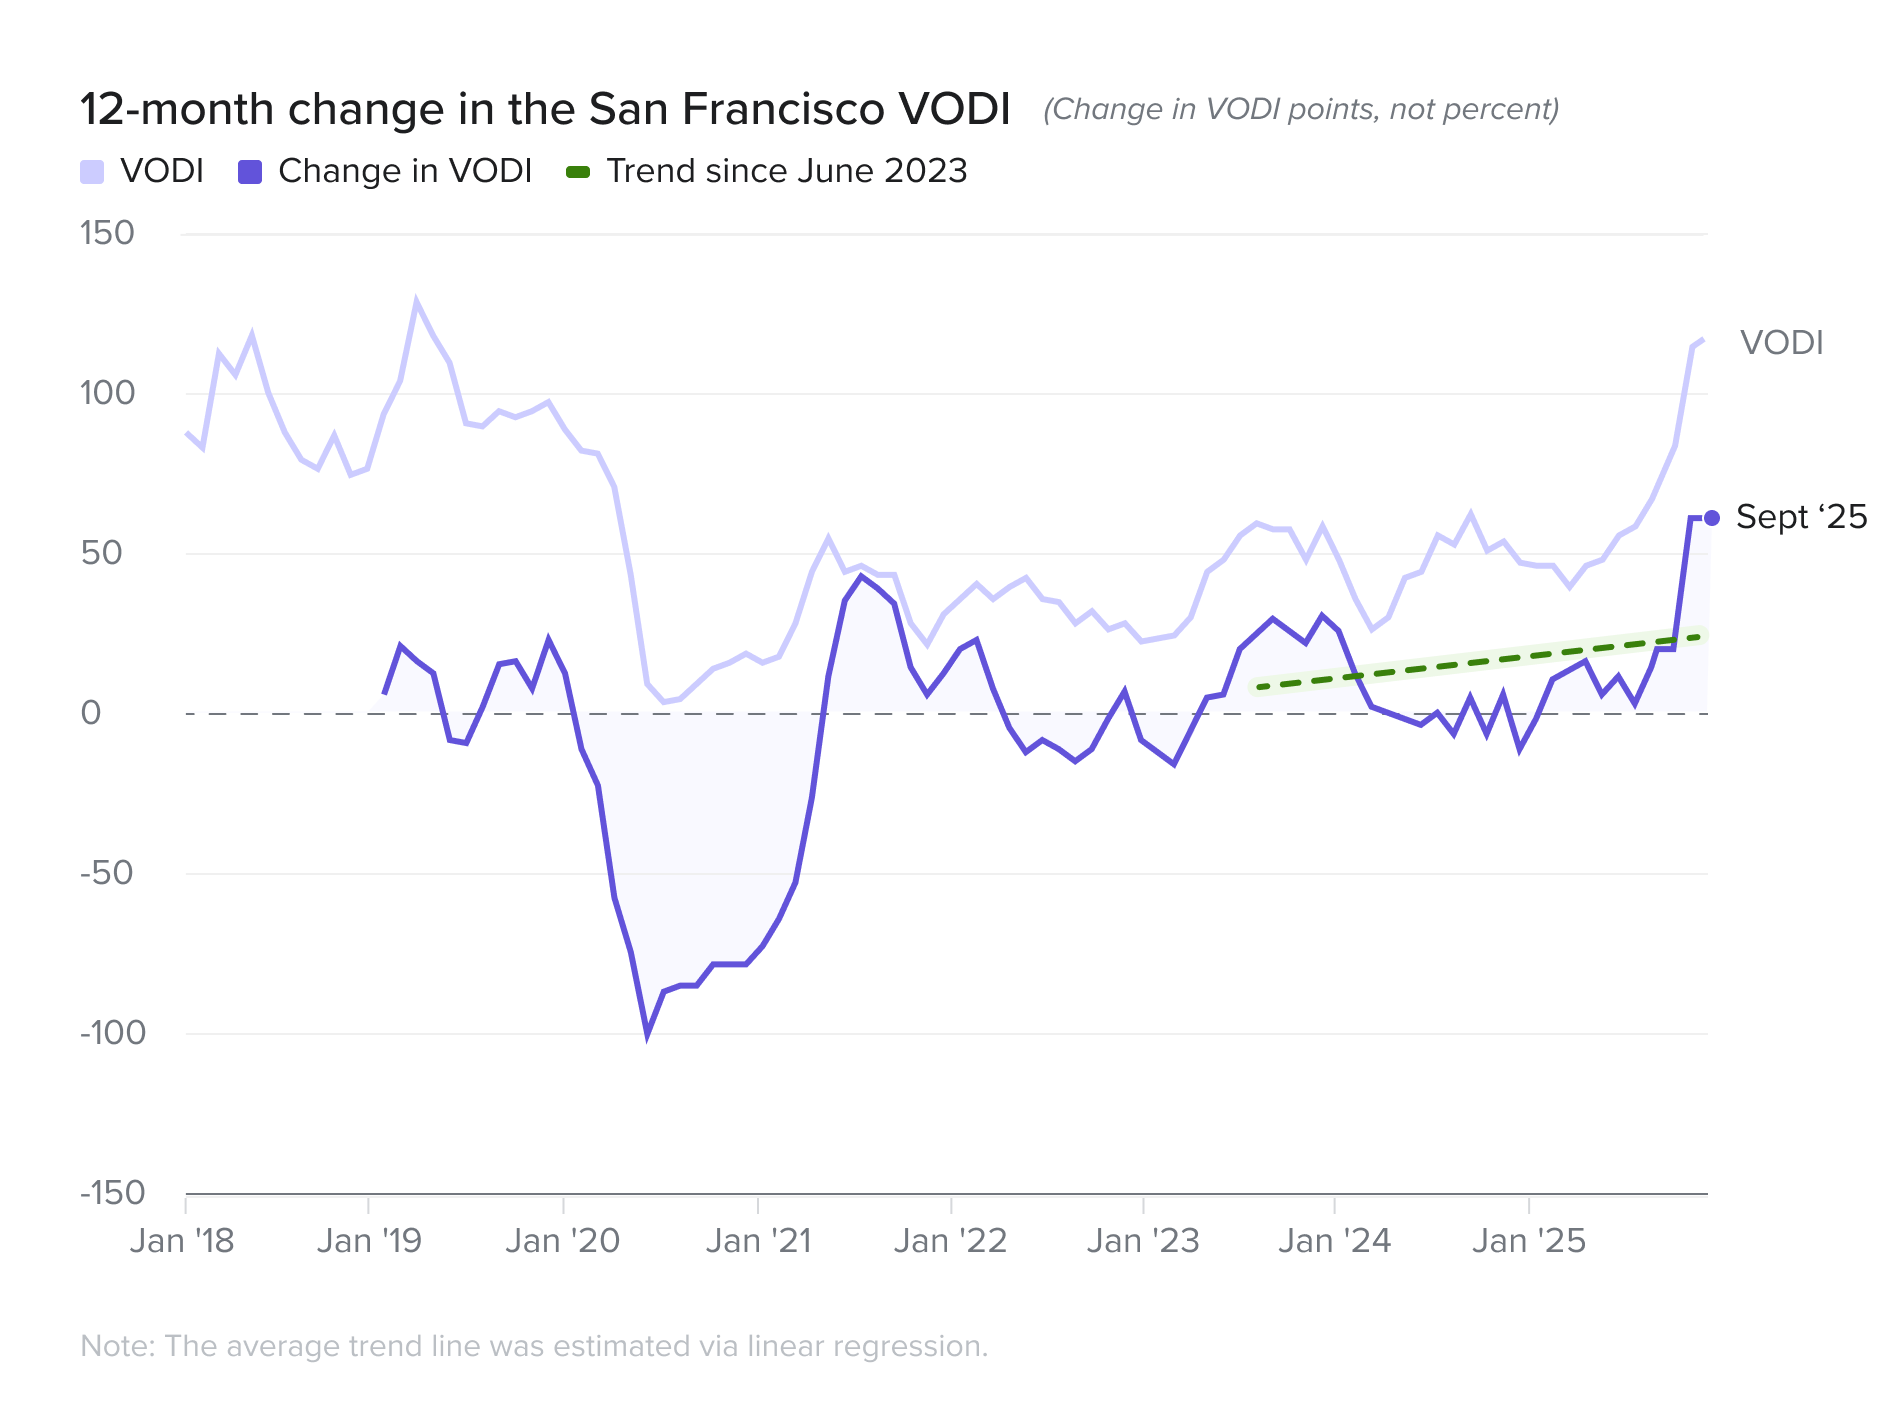
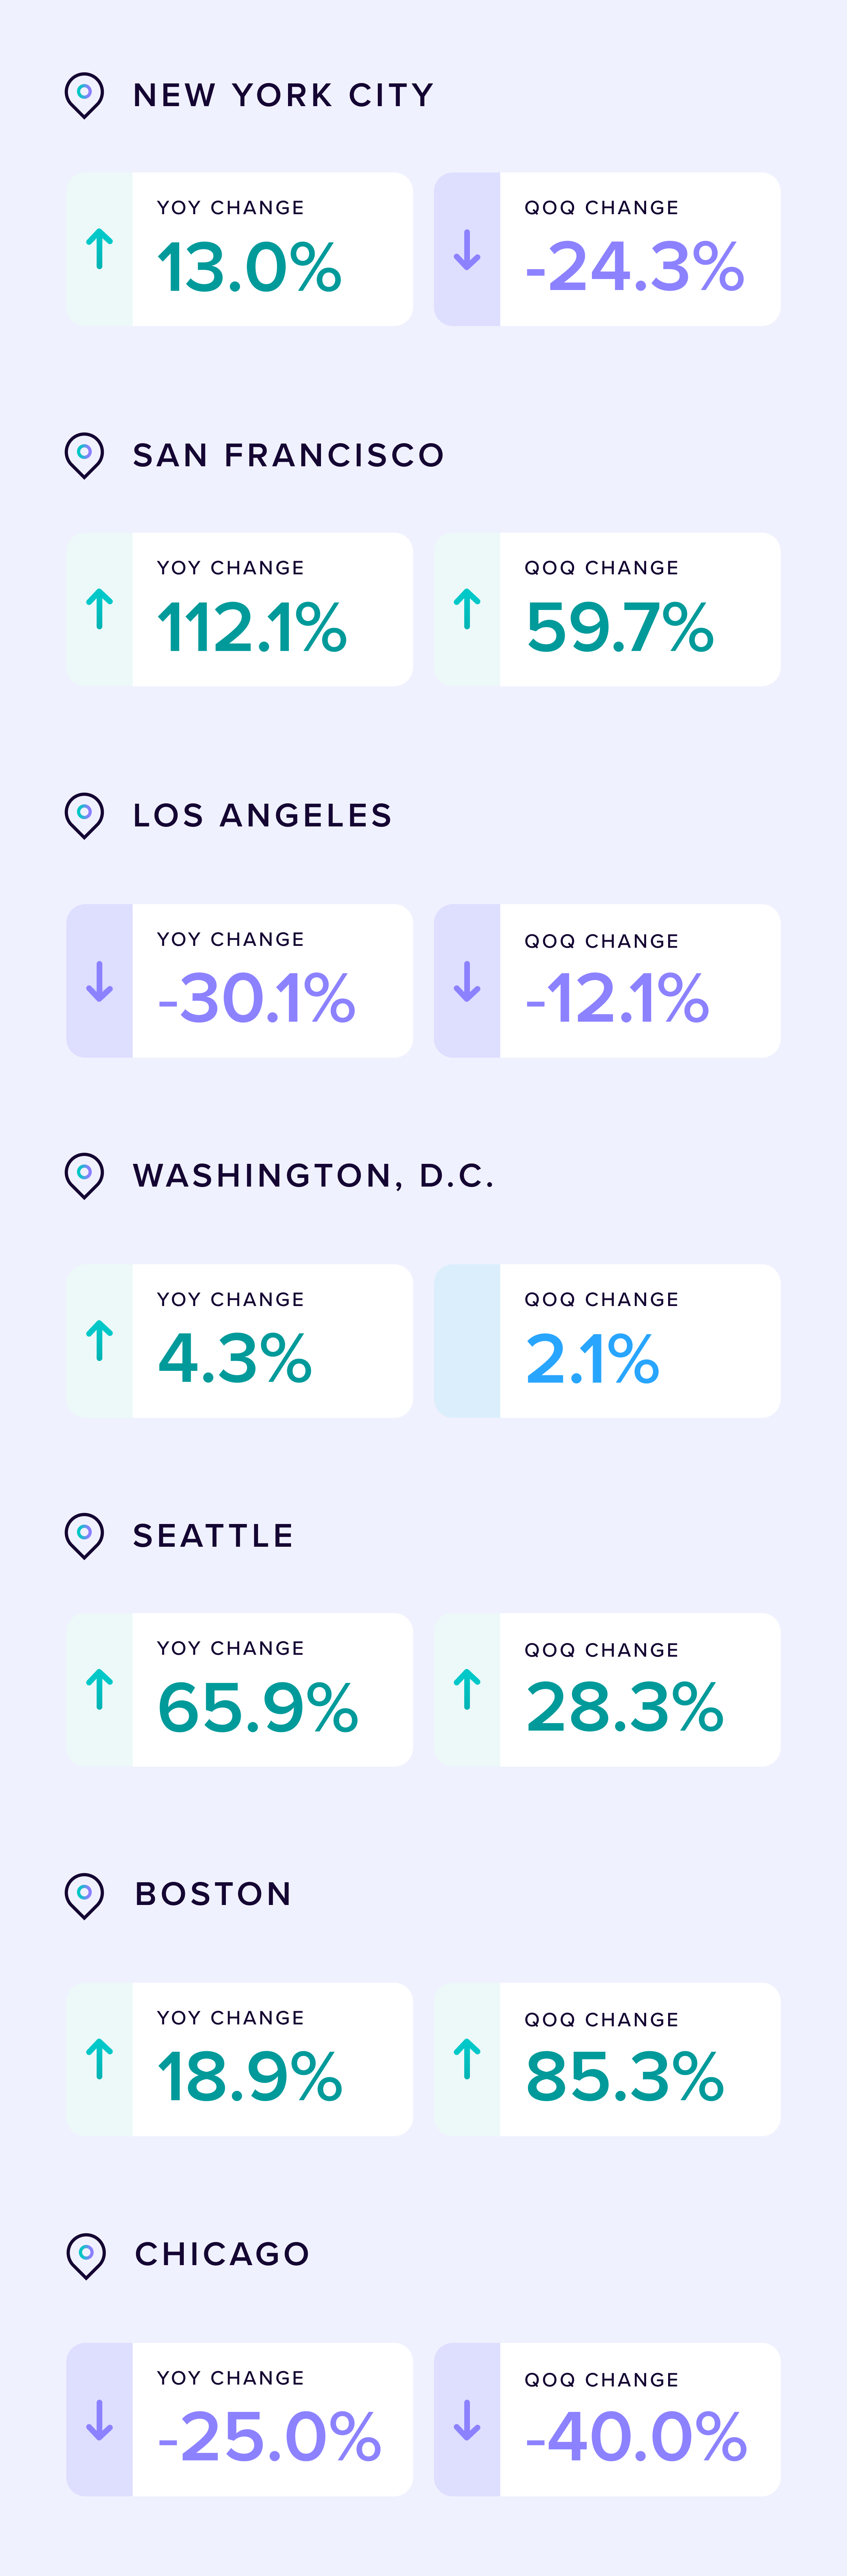
San Francisco continues to rapidly recover, with its VODI surging 60 percent quarter-over-quarter to 123, a 112 percent year-over-year gain that cements its status as the nation's top performing market this quarter. The AI-driven boom has accelerated, overwhelmingly powered by large tenants leading a national tech renaissance. Demand from this segment skyrocketed by triple digits in a single quarter.
12 month change in VODI
PREVIOUS
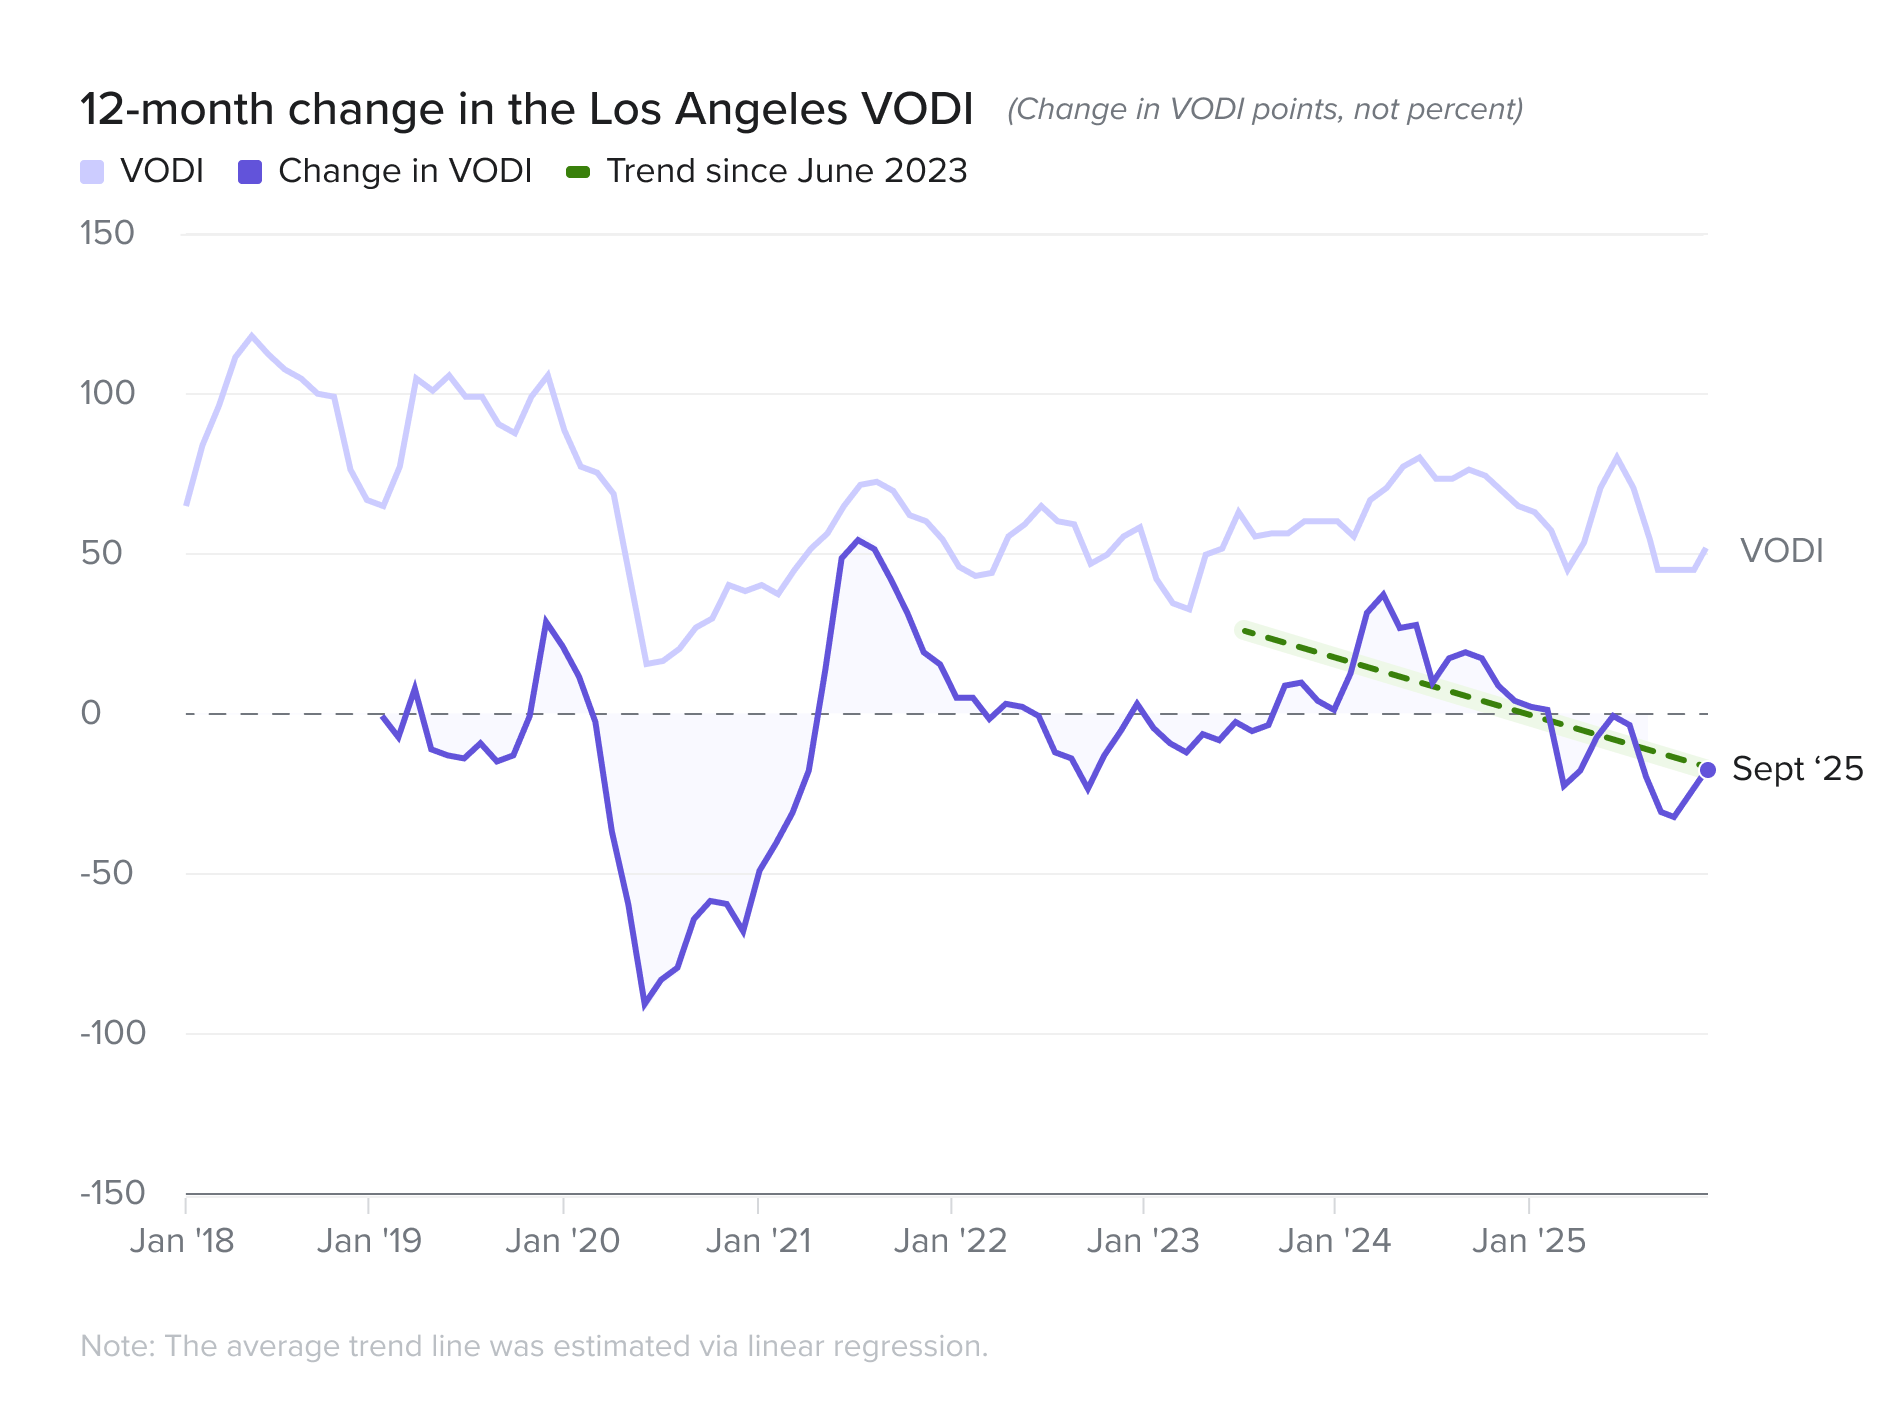
Other major markets showed mixed or negative signals. Los Angeles continued its prolonged decline despite quarterly gains from its core Creative sector not able to pull into the green. While Washington, D.C.'s underlying weakness in its core government-related sector leaves it uniquely exposed to the federal shutdown in addition to cuts to federal spending coming up to head.
NEXT
PREVIOUS
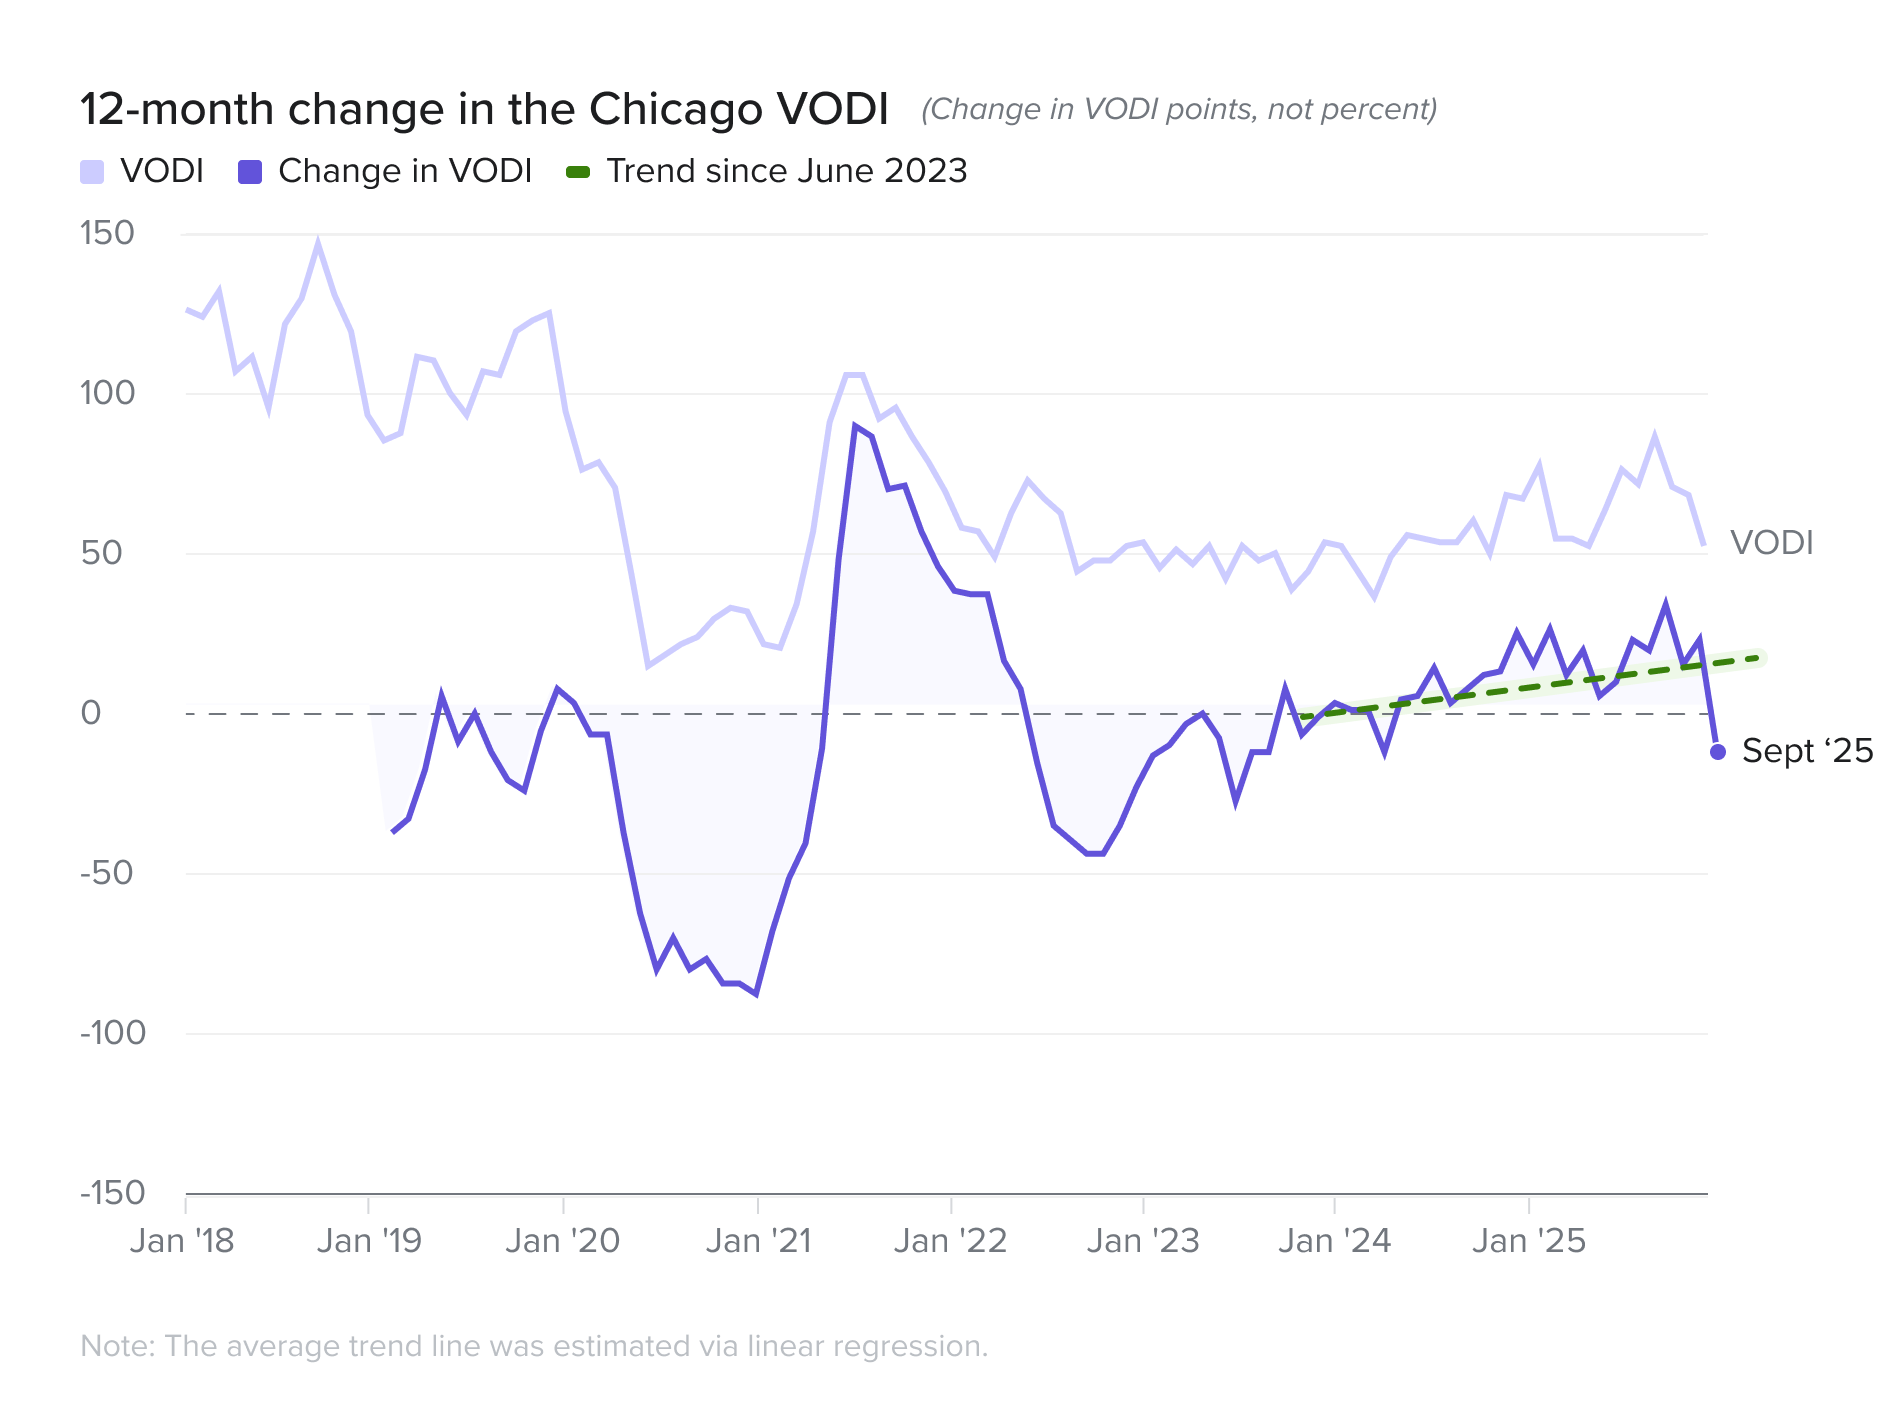
In stark contrast, the nation’s recent high performers hit pause. Chicago, the standout leader of the prior quarter, plummeted by 40 percent as the large-tenant demand that fueled its rise declined. New York's demand contracted sharply by 24 percent, driven by weakness in its core Finance and Legal sectors. A massive surge in demand for flexible office space and a healthy increase in Tech demand was not enough to counter the deceleration in the core sectors.
NEXT
Boston
Chicago
Los Angeles
New York
San Francisco
Seattle
Washington, D.C.


BOOK A DEMO

NEXT
NEXT
PREV
PREV
PREV
The VTS Office Demand Index (VODI) report is a free public-facing analysis based on VTS Data from the previous quarter, capturing office demand in the nation's seven gateway markets. Our VTS Data product includes comprehensive in-depth analytics of numerous benchmarks in over 30 markets across the U.S., the U.K., and Canada. For more information on what VTS Data can provide you, please connect with our team below.
BOOK A DEMO
NEXT
NEXT
NEXT
PREV
PREV
The "push and pull" between employers and employees over remote work saw a surprising slight reversal in the second quarter. After a three year decline, the share of job searches for remote work increased from 6.7 percent to 7.8 percent during the second quarter - the third highest quarterly increase - only behind the increases in Q3 2021 and Q1 2020. This implies employer leverage in the push for a return-to-office is more nuanced and less linear than is commonly thought.


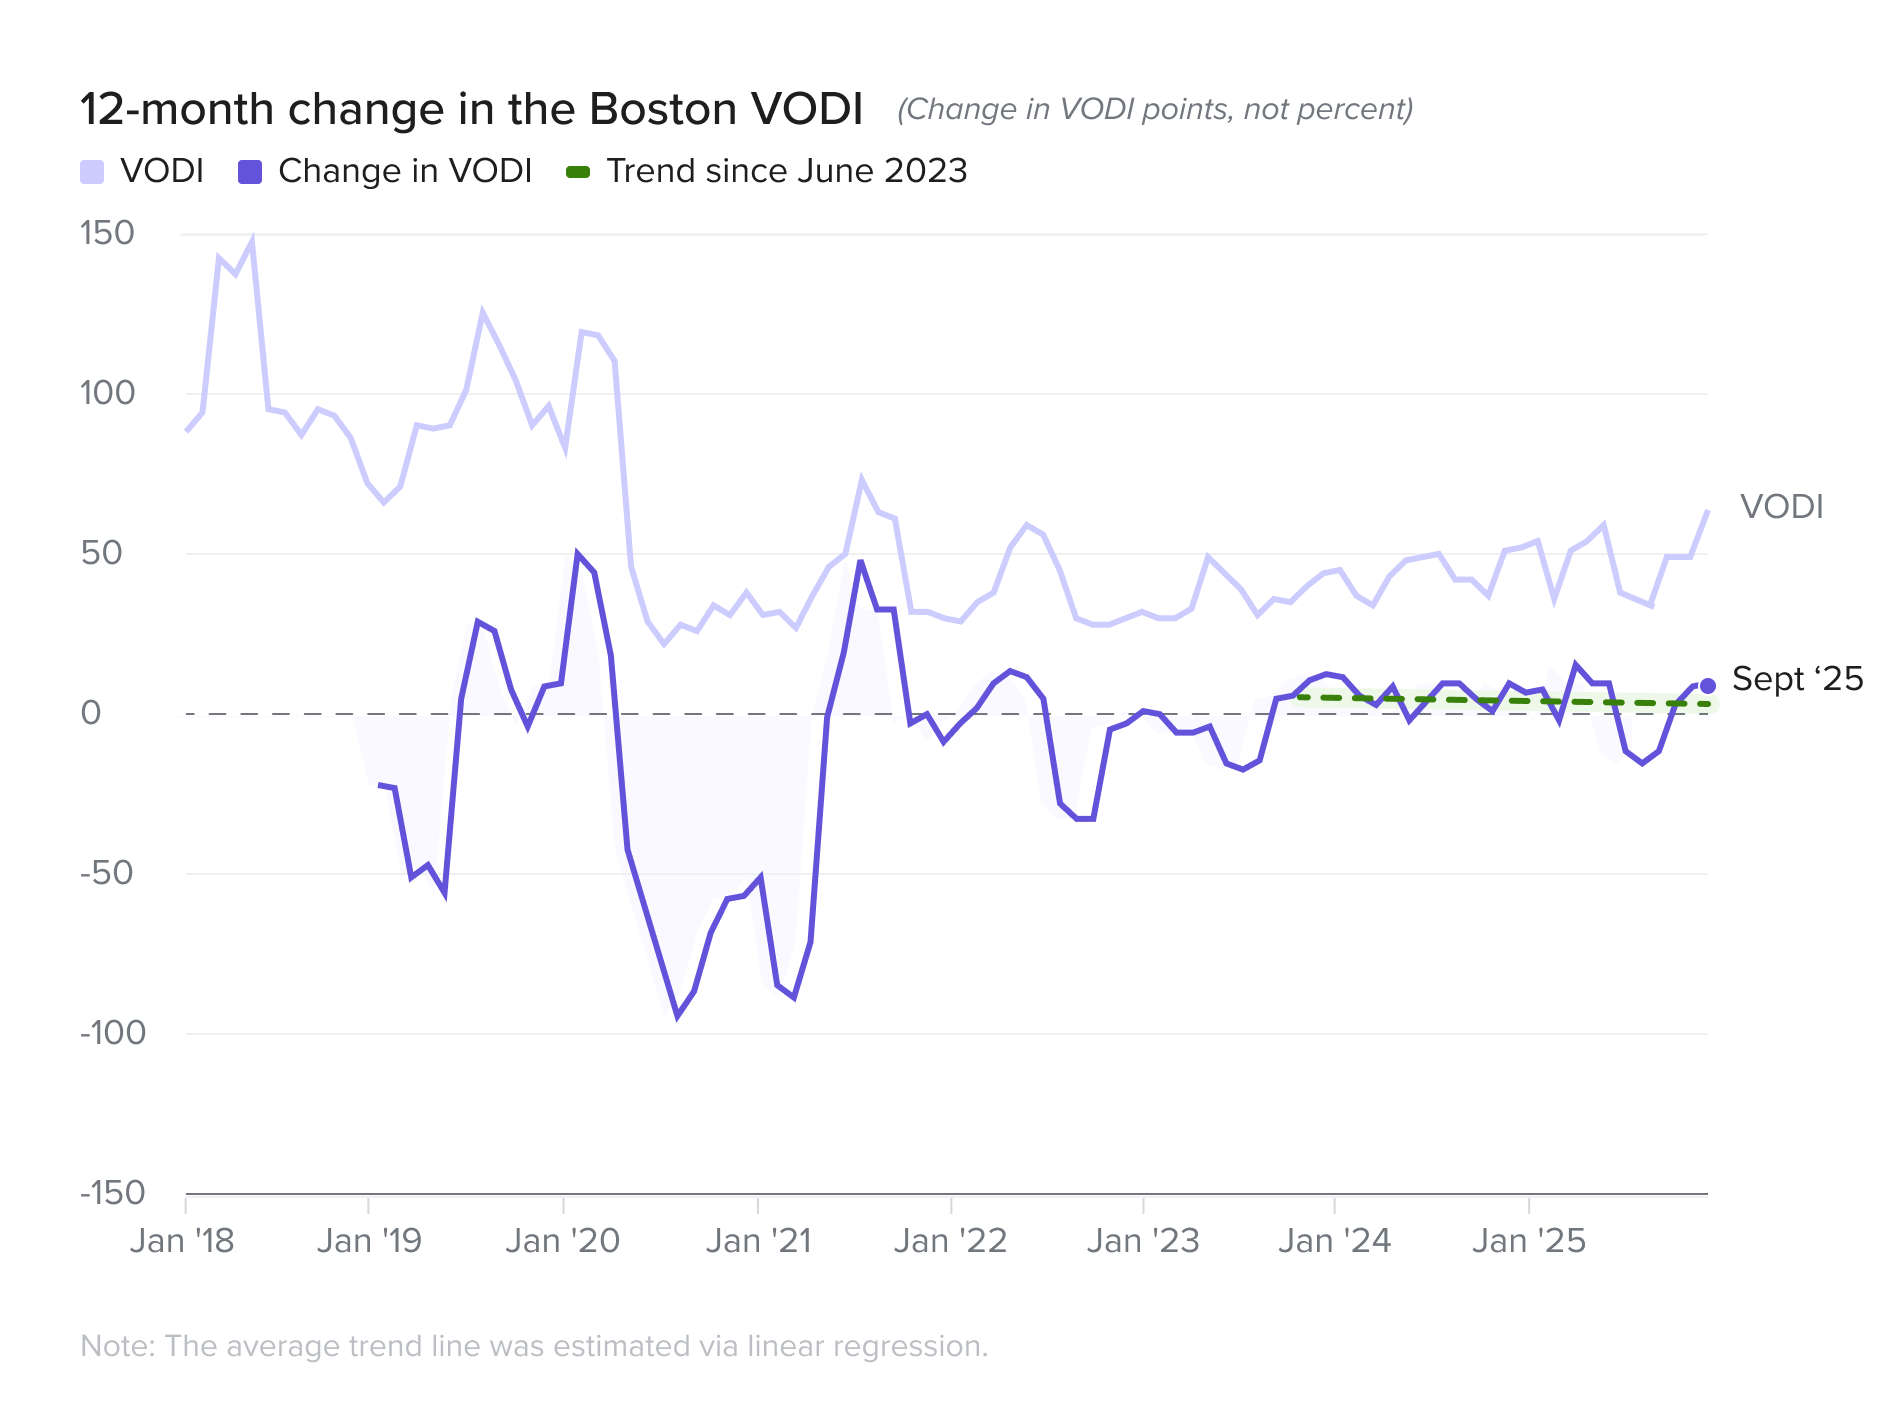
Lastly, Boston’s VODI fell 25.0 percent from its June 2024 level, but the quarterly picture is even more stark, with demand plummeting 45.9 percent.
Boston reversed course in Q2. After multiple quarters over the past year of new demand totaling 2M square feet or more, large tenants disappeared from the market and Boston had its worst quarter for demand in the post-pandemic period.
Headline office demand growth was stable in Q2 2025, masking underlying volatility across markets. The National VTS Office Demand Index (VODI) ended June at a level of 70, 11.1 percent higher than the VODI of 63 recorded in June 2024. The index was flat quarter-over-quarter, down 1.4 percent from 71 in March 2025, as uncertainty abounded from a changing landscape in global trade policy, geopolitical escalations, and as office-using firms try to establish the short- and long-term impacts of AI on productivity and the workforce.
PREVIOUS

Bifurcation is accelerating between markets with a high concentration of remote-friendly industries and those reliant on traditional, office-centric sectors. Demand in "Remote-Heavy Markets" (DC, BOS, SF, SEA) surged 47 percent quarter-over-quarter, while "Non-Remote-Heavy Markets" (NY, LA, CHI) were meaningfully down 26 percent. This widening gap reflects how markets like New York and Los Angeles outperformed in the immediate post-Covid years and how markets like San Francisco are riding this recent wave in Tech demand.
NEXT
The national VTS Office Demand Index (VODI) finished Q3 2025 at 72. While this is a strong 16 percent year-over-year increase, it marks a four percent decline from Q2 2025 as uncertainty in the macroeconomic environment has crept in. This cooling coincides with a labor market that was already moderating, with the August 2025 unemployment rate at 4.3 percent, up slightly from June 2025 (4.1 percent) and the prior year (4.2 percent). The federal government shutdown has compounded this uncertainty by delaying the release of September's jobs report, leaving the country without a clear, real-time picture of the labor market's health.
�
Q3 data clearly showed that the office market's bifurcation along remote work lines is a recent trend that is accelerating. The performance gap between markets home to industries conducive to remote work and those that are not has widened dramatically. The tenant demand index for "Remote Heavy" markets increased by a remarkable 47 percent quarter-over-quarter. In stark contrast, "Non-Remote Heavy" markets experienced a severe 26 percent quarterly decline. This divergence reflects a fundamental economic realignment, as "Remote Heavy" markets are largely dominated by high-growth industries like technology and life sciences. The winners in the current office market will be those cities that can create ecosystems catering to these high-growth industries.
�

NATIONAL VODI RESULTS


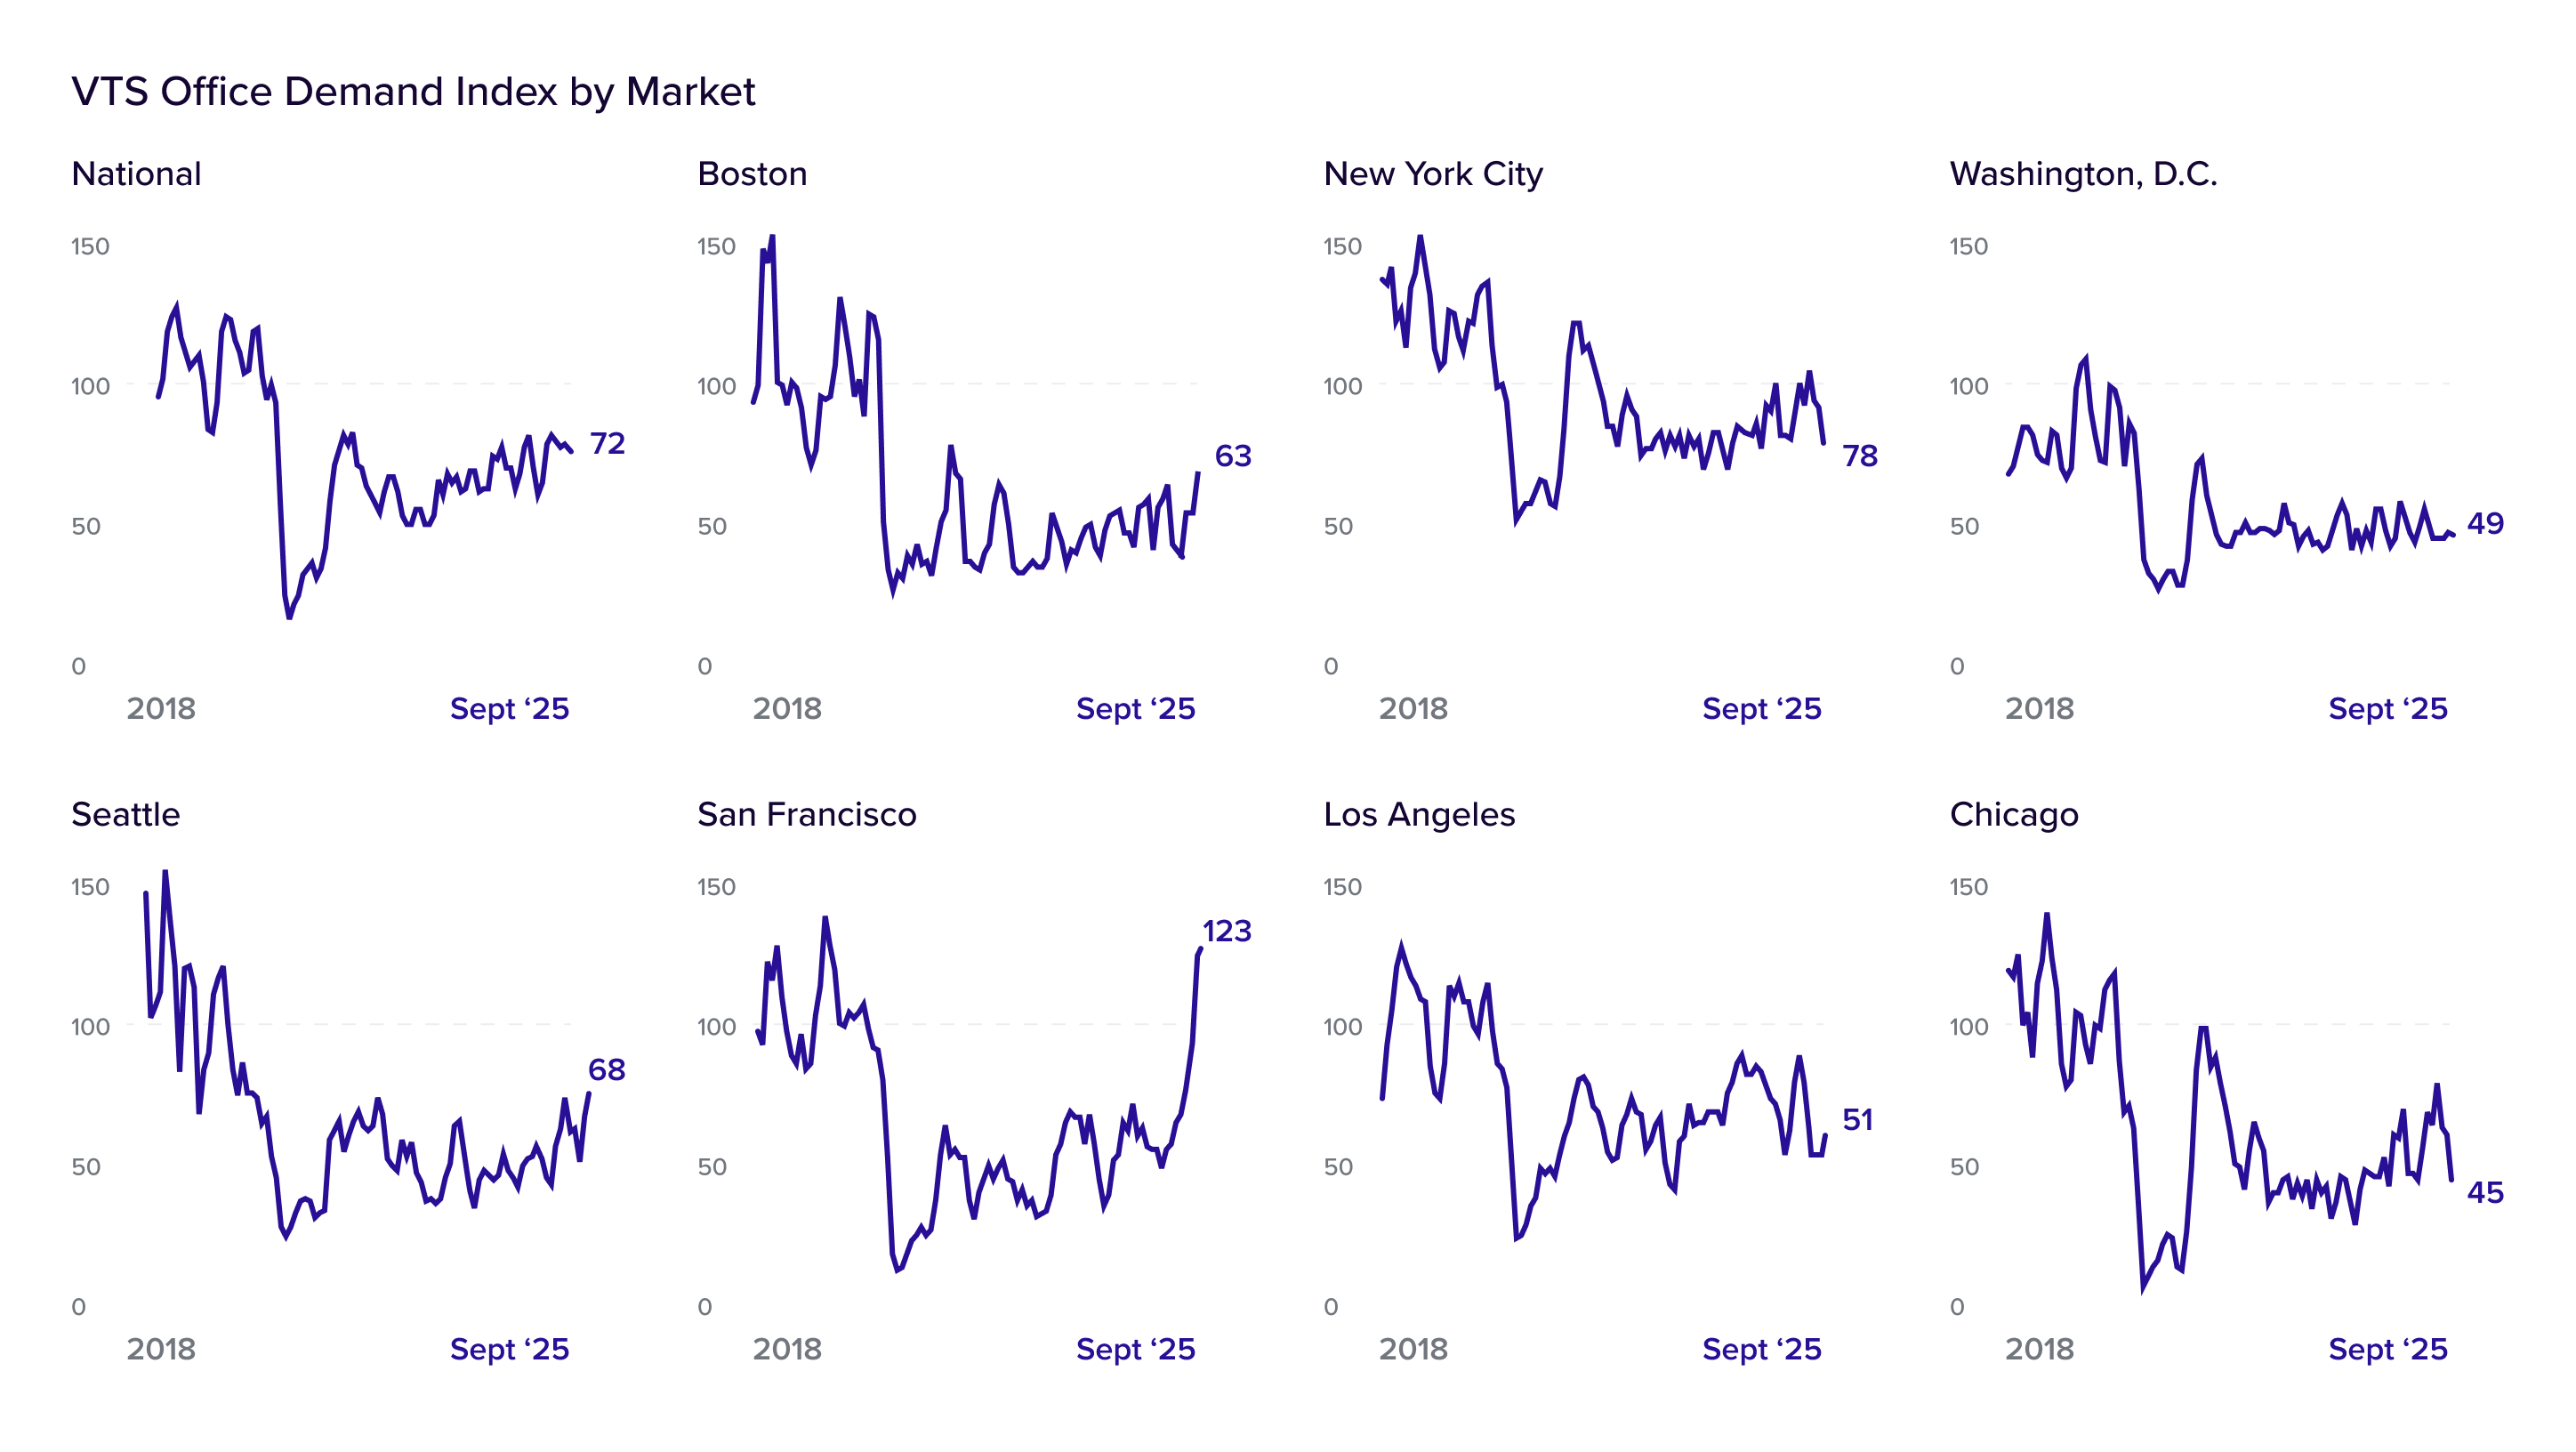
The market's prolonged decline continued, with its VODI falling 12 percent quarter-over-quarter to 51, leaving it down 30 percent year-over-year. Los Angeles continues to lack a strong positive catalyst. Demand from large tenants fell another 55 percent quarter-over-quarter, and modest recoveries in the Creative and Tech sectors were not enough to offset broad weakness elsewhere.
decline quarter-over-quarter
12%
los angeles


Still lagging behind: �Los Angeles
�
Markets in Focus
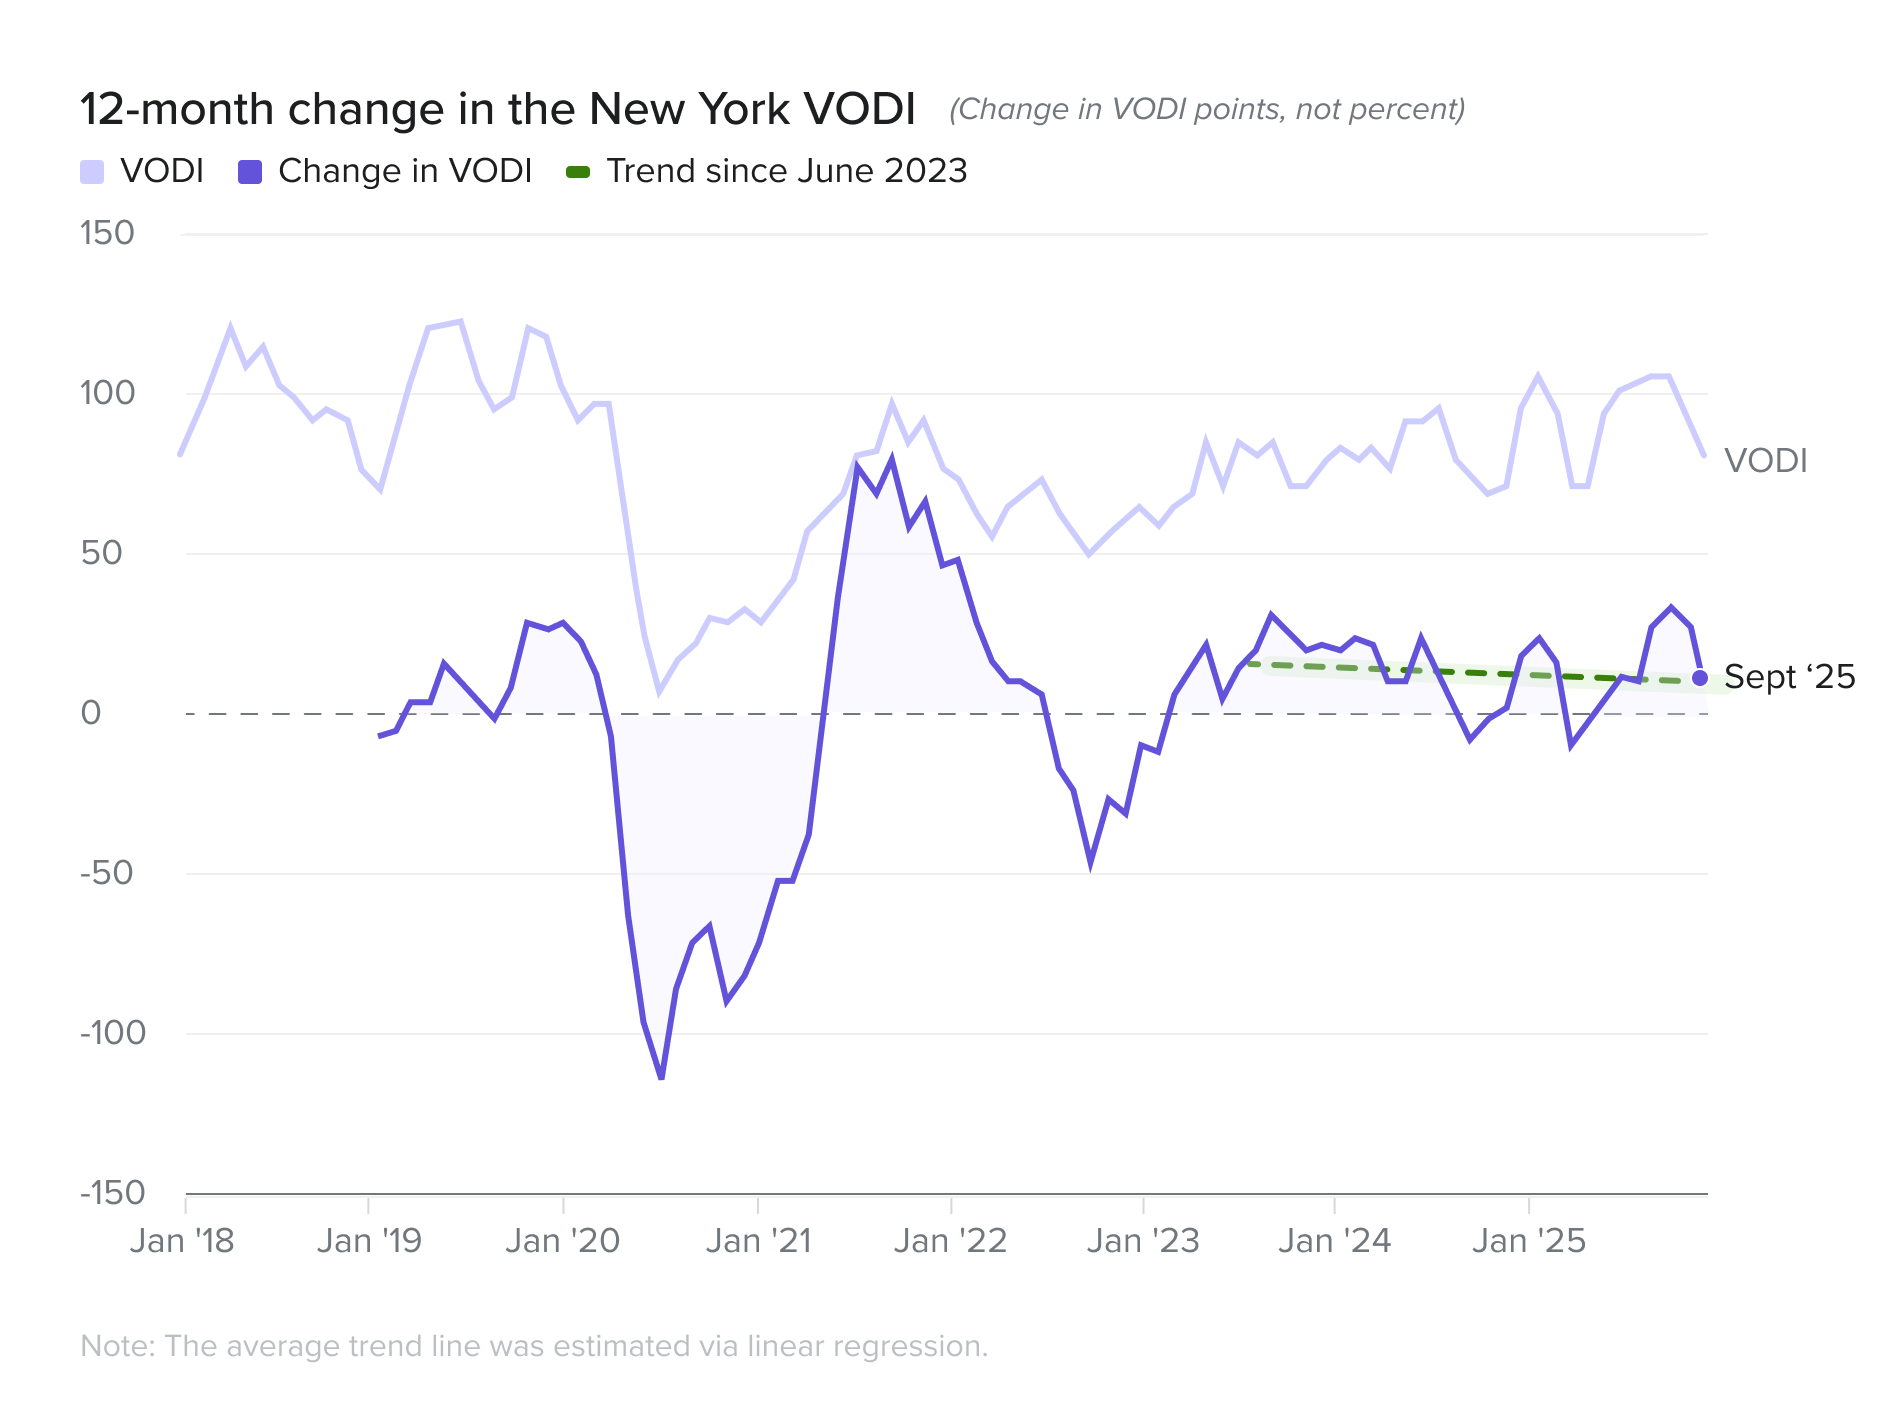
New demand contracted sharply in the nation's largest office market, with its VODI falling 24 percent quarter-over-quarter to 78. Weakness was concentrated in its traditional power centers, with demand from the Finance and Legal sectors falling double digits. Despite solid gains from Flex Space providers and Association/Non-Profits, these increases were not enough to offset the decline in its power industries.
decline quarter-over-quarter
24%
New york city
After a standout previous quarter, Chicago's VODI collapsed by 40 percent quarter-over-quarter to 45, erasing all recent gains and leaving it down 25 percent year-over-year. The drivers of the prior surge vanished as large tenant demand evaporated - falling by 66 percent. The decline was broad and severe, impacting key sectors like Creative, Legal, and Tech, highlighting the fragility of markets lacking a dominant, secular growth driver.
decline quarter-over-quarter
40%
chicago
The quarterly correction: �Chicago and New York City
�
Markets in Focus
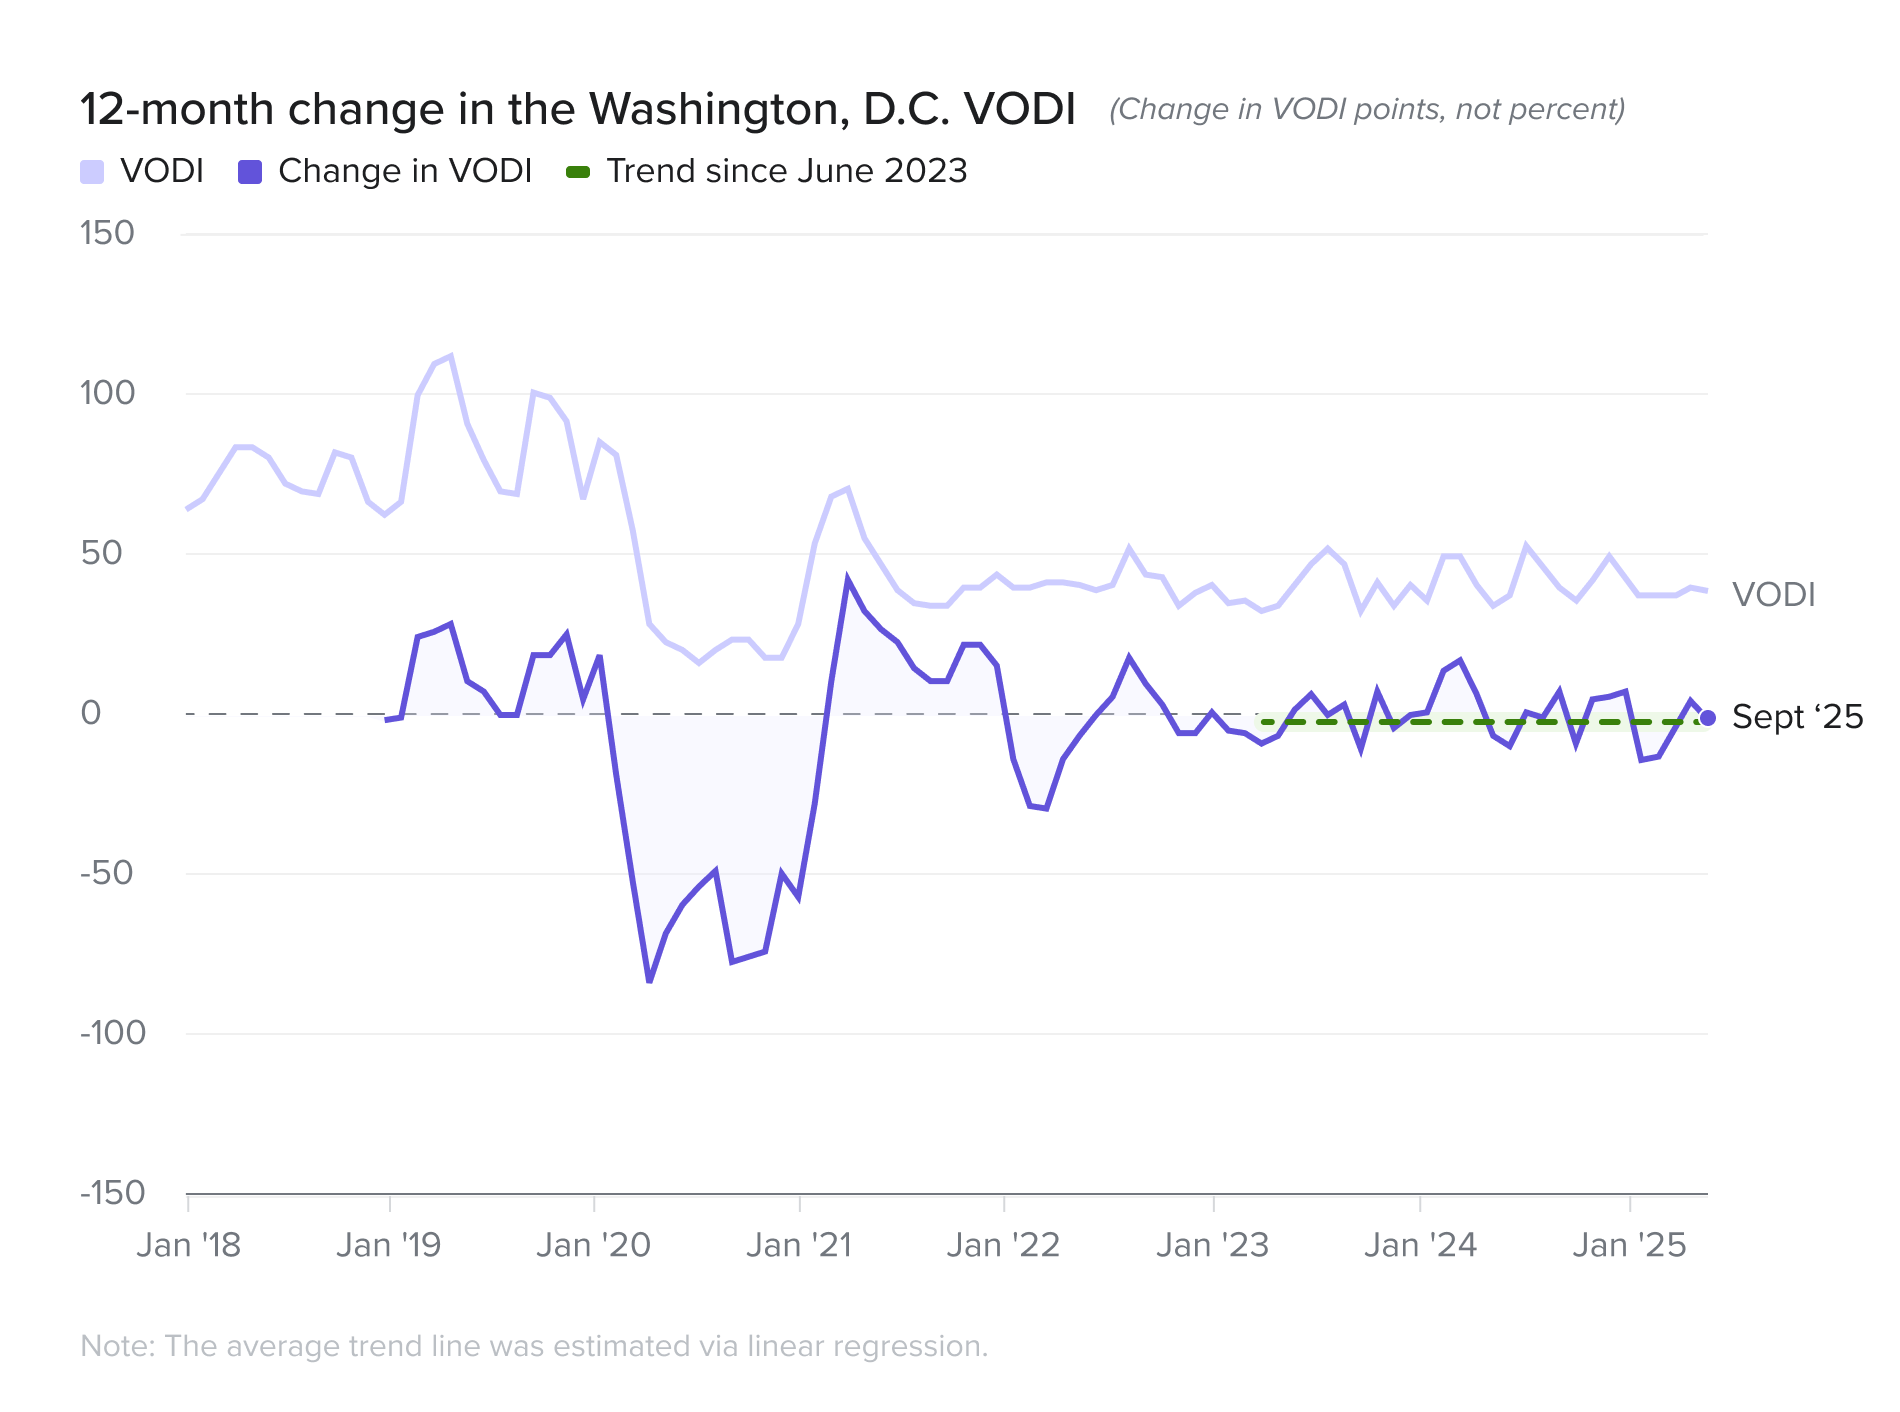
Washington, D.C.'s VODI posted a modest 2 percent quarterly gain to 49. However, this masks a concerning trend. The market's core demand drivers, Association/Nonprofit and Government, declined by 34 percent and 9 percent quarter-over-quarter, respectively. The market was held in positive territory only by cyclical gains from the Finance and Legal sectors. This means Washington, D.C. entered the federal government shutdown with its primary, most stable demand drivers already in retreat, making it uniquely vulnerable to a prolonged impasse.
quarterly gain
2%
Washington, D.c.
Deceptive stability on the eve of the shutdown: Washington, D.C.
�
Markets in Focus
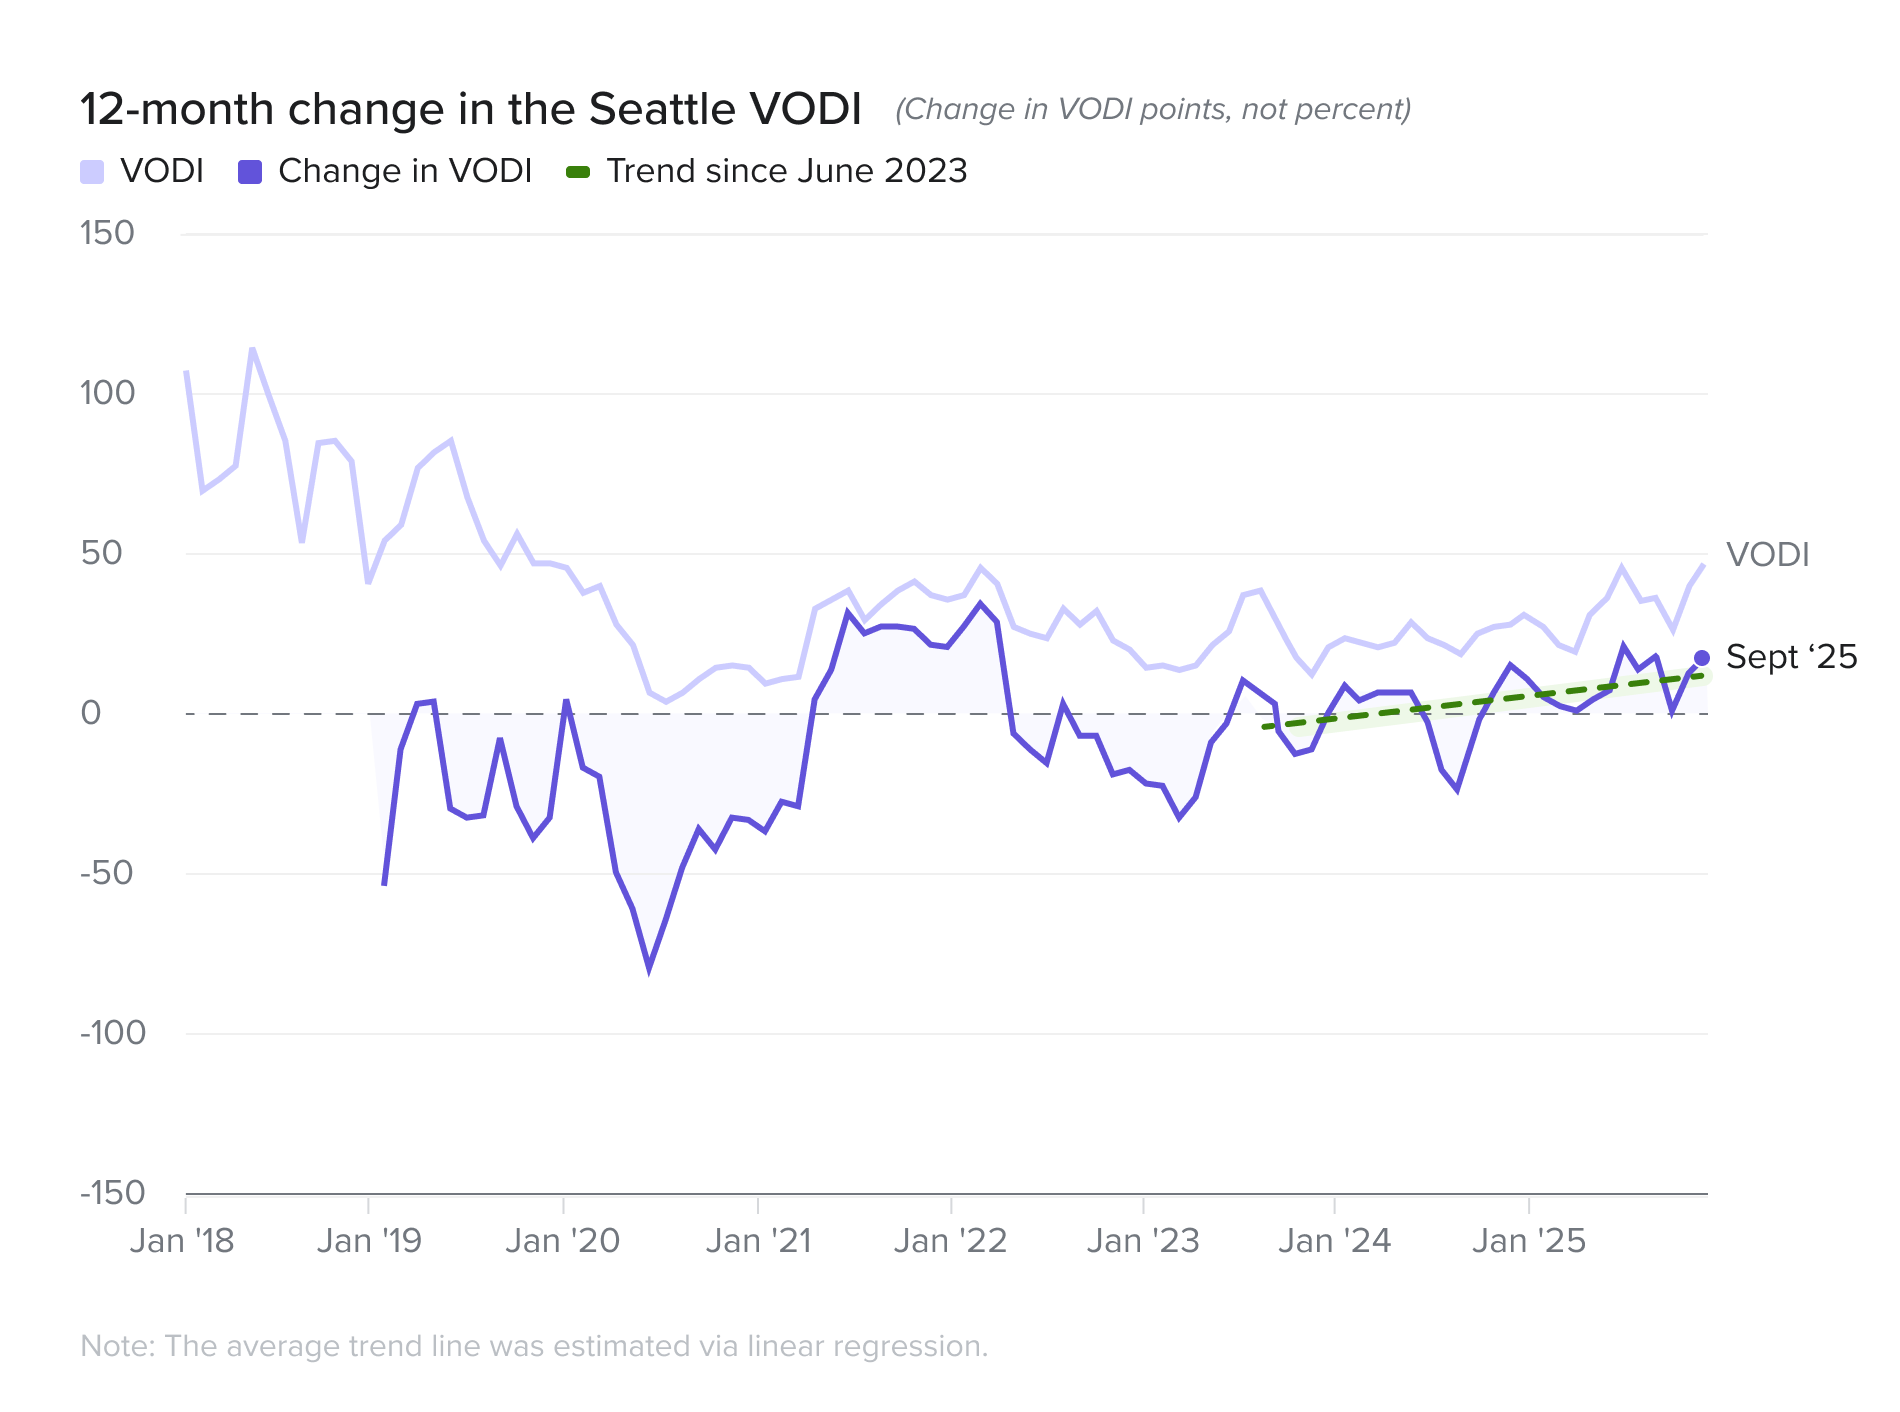
The Seattle market staged a solid recovery from its Q2 slump, with its VODI rising 28 percent quarter-over-quarter to 68, bringing its year-over-year growth to a strong 66 percent. Tenant demand was powered by the mid-block and driven recently by unusually diverse non-traditional industries for the market such as the Association/Non-profit and Creative sectors. Tech remains a big component, with demand from this sector more than double what was seen in all of 2024, and three months of the year still remaining.
increase quarter-over-quarter
28%
Seattle
Executing the quarter's most dramatic turnaround after a dismal second quarter, Boston's VODI soared 85 percent quarter-over-quarter to 63, a 19 percent year-over-year gain. The recovery was driven by the return of large tenants, with demand from this block increasing by 528 percent quarter-over-quarter. This resurgence, powered by the city's core Tech and Legal industries, reflects a broader national trend of large occupiers strategically consolidating into a few select markets.
increase quarter-over-quarter
85%
boston
increase quarter-over-quarter
60%
SAN FRANCISCO


Read VODI impacts on local markets
The third quarter of 2025 was defined by extreme volatility and a dramatic reordering of local market performance. National averages mask a series of intensely local and disparate stories. The following table summarizes the headline performance of the seven major U.S. office markets tracked by the VODI.
A great divergence in market fortunes
local VODI RESULTS
LOCAL
PREV
The labor market presented a mixed picture in Q2. While the index of job postings continued to cool, declining by 2.4 percent over the quarter, office-using employment ended its prior contraction in Q1 as 47,000 new office-using jobs were added in Q2. While this pace is above the trailing 3-month average over the last year, it’s below the 100k+ pace seen pre-pandemic and in the post-pandemic recovery. Remote work saw a slight reversal from its long-term decline at the end of Q2. The share of job searches for remote roles was down 270 bps from the peaks in early-2023 to May 2025. Remote postings increased 30 bps in June 2025.
NEXT
Markets in Focus
The market is currently caught between two recent powerful and opposing macroeconomic forces. The federal government shutdown, effective October 1, presents a significant headwind, immediately halting new federal leasing and imposing an "uncertainty tax" on the private sector that discourages long-term commitments. In direct contrast, the U.S. Federal Reserve's 25 basis point interest rate cut acts as a potential tailwind by reducing borrowing costs for working capital as firms ponder expanding. However, this stimulus is a double-edged sword, as rate cuts also signal the central bank's concern about underlying economic health, the ultimate driver of tenant demand. Notwithstanding, there is still an ongoing trade war which has negatively impacted business and consumer confidence. The market's trajectory will be defined by the tension between the shutdown's cooling effect on confidence and the rate cut's stimulus to capital markets.
Annual demand gains on the back of a quarterly deceleration
NATIONAL VODI RESULTS
The market is currently caught between two recent powerful and opposing macroeconomic forces. The federal government shutdown, effective October 1, presents a significant headwind, immediately halting new federal leasing and imposing an "uncertainty tax" on the private sector that discourages long-term commitments. In direct contrast, the U.S. Federal Reserve's 25 basis point interest rate cut acts as a potential tailwind by reducing borrowing costs for working capital as firms ponder expanding. However, this stimulus is a double-edged sword, as rate cuts also signal the central bank's concern about underlying economic health, the ultimate driver of tenant demand. Notwithstanding, there is still an ongoing trade war which has negatively impacted business and consumer confidence. The market's trajectory will be defined by the tension between the shutdown's cooling effect on confidence and the rate cut's stimulus to capital markets.

San Francisco continues to rapidly recover, with its VODI surging 60 percent quarter-over-quarter to 123, a 112 percent year-over-year gain that cements its status as the nation's top performing market this quarter. The AI-driven boom has accelerated, overwhelmingly powered by large tenants leading a national tech renaissance. Demand from this segment skyrocketed by triple digits in a single quarter.
increase year-over-year
60%
San Franscisco
Executing the quarter's most dramatic turnaround after a dismal second quarter, Boston's VODI soared 85 percent quarter-over-quarter to 63, a 19 percent year-over-year gain. The recovery was driven by the return of large tenants, with demand from this block increasing by 528 percent quarter-over-quarter. This resurgence, powered by the city's core Tech and Legal industries, reflects a broader national trend of large occupiers strategically consolidating into a few select markets.
increase quarter-over-quarter
85%
boston
San Franscisco
Markets in Focus
The tech-driven powerhouses:�San Francisco, Boston, and Seattle
�
�
San Francisco continues to rapidly recover, with its VODI surging 60 percent quarter-over-quarter to 123, a 112 percent year-over-year gain that cements its status as the nation's top performing market this quarter. The AI-driven boom has accelerated, overwhelmingly powered by large tenants leading a national tech renaissance. Demand from this segment skyrocketed by triple digits in a single quarter.
increase year-over-year
60%
San Franscisco
Executing the quarter's most dramatic turnaround after a dismal second quarter, Boston's VODI soared 85 percent quarter-over-quarter to 63, a 19 percent year-over-year gain. The recovery was driven by the return of large tenants, with demand from this block increasing by 528 percent quarter-over-quarter. This resurgence, powered by the city's core Tech and Legal industries, reflects a broader national trend of large occupiers strategically consolidating into a few select markets.
increase quarter-over-quarter
85%
boston
Markets in Focus
The tech-driven powerhouses:�San Francisco, Boston, and Seattle
�
�
San Francisco continues to rapidly recover, with its VODI surging 60 percent quarter-over-quarter to 123, a 112 percent year-over-year gain that cements its status as the nation's top performing market this quarter. The AI-driven boom has accelerated, overwhelmingly powered by large tenants leading a national tech renaissance. Demand from this segment skyrocketed by triple digits in a single quarter.
increase year-over-year
60%
chicago
Markets in Focus
The quarterly correction: �Chicago and New York City
�
After a standout previous quarter, Chicago's VODI collapsed by 40 percent quarter-over-quarter to 45, erasing all recent gains and leaving it down 25 percent year-over-year. The drivers of the prior surge vanished as large tenant demand evaporated - falling by 66 percent. The decline was broad and severe, impacting key sectors like Creative, Legal, and Tech, highlighting the fragility of markets lacking a dominant, secular growth driver.
decline quarter-over-quarter
40%
Boston
Chicago
Los Angeles
New York
San Francisco
Seattle
Washington, D.C.
12 month change in VODI
NEXT
PREV
This volatility is unfolding against a backdrop of powerful, opposing macroeconomic forces: a federal government shutdown that began on October 1 – injecting uncertainty and delaying release of key economic data, and a 25 basis point interest rate cut by the U.S. Federal Reserve, aimed at stimulating investment and job growth in a stalled labor market where the unemployment rate increased to 4.3 percent from June’s 4.1 percent, and any job gains in Q3 were revised downward.
NATIONAL
The market is currently caught between two recent powerful and opposing macroeconomic forces. The federal government shutdown, effective October 1, presents a significant headwind, immediately halting new federal leasing and imposing an "uncertainty tax" on the private sector that discourages long-term commitments. In direct contrast, the U.S. Federal Reserve's 25 basis point interest rate cut acts as a potential tailwind by reducing borrowing costs for working capital as firms ponder expanding. However, this stimulus is a double-edged sword, as rate cuts also signal the central bank's concern about underlying economic health, the ultimate driver of tenant demand. Notwithstanding, there is still an ongoing trade war which has negatively impacted business and consumer confidence. The market's trajectory will be defined by the tension between the shutdown's cooling effect on confidence and the rate cut's stimulus to capital markets.
Annual demand gains on the back of a quarterly deceleration
NATIONAL VODI RESULTS
Read VODI impacts on local markets
The market is currently caught between two recent powerful and opposing macroeconomic forces. The federal government shutdown, effective October 1, presents a significant headwind, immediately halting new federal leasing and imposing an "uncertainty tax" on the private sector that discourages long-term commitments. In direct contrast, the U.S. Federal Reserve's 25 basis point interest rate cut acts as a potential tailwind by reducing borrowing costs for working capital as firms ponder expanding. However, this stimulus is a double-edged sword, as rate cuts also signal the central bank's concern about underlying economic health, the ultimate driver of tenant demand. Notwithstanding, there is still an ongoing trade war which has negatively impacted business and consumer confidence. The market's trajectory will be defined by the tension between the shutdown's cooling effect on confidence and the rate cut's stimulus to capital markets.
quarterly gain
2%
Washington, D.c.
Washington, D.C.'s VODI posted a modest 2 percent quarterly gain to 49. However, this masks a concerning trend. The market's core demand drivers, Association/Nonprofit and Government, declined by 34 percent and 9 percent quarter-over-quarter, respectively. The market was held in positive territory only by cyclical gains from the Finance and Legal sectors. This means Washington, D.C. entered the federal government shutdown with its primary, most stable demand drivers already in retreat, making it uniquely vulnerable to a prolonged impasse.
Deceptive stability on the eve of the shutdown: Washington, D.C.
Markets in Focus
increase year-over-year
60%
San Franscisco
San Francisco continues to rapidly recover, with its VODI surging 60 percent quarter-over-quarter to 123, a 112 percent year-over-year gain that cements its status as the nation's top performing market this quarter. The AI-driven boom has accelerated, overwhelmingly powered by large tenants leading a national tech renaissance. Demand from this segment skyrocketed by triple digits in a single quarter.
The tech-driven powerhouses:�San Francisco, Boston, and Seattle
Markets in Focus
increase year-over-year
60.4%
Chicago AND San Franscisco
Chicago's VODI rocketed up 60.4 percent year-over-year and an impressive 35.1 percent since March led by the legal and finance sectors.
San Francisco also showed strong momentum, with its VODI rising 27.3 percent year-over-year and surging 40 percent since the end of Q1, fueled by a rebound in tech demand that continues to be led by the push in AI.
increase year-over-year
60%
San Franscisco
San Francisco continues to rapidly recover, with its VODI surging 60 percent quarter-over-quarter to 123, a 112 percent year-over-year gain that cements its status as the nation's top performing market this quarter. The AI-driven boom has accelerated, overwhelmingly powered by large tenants leading a national tech renaissance. Demand from this segment skyrocketed by triple digits in a single quarter.
increase quarter-over-quarter
85%
boston
Executing the quarter's most dramatic turnaround after a dismal second quarter, Boston's VODI soared 85 percent quarter-over-quarter to 63, a 19 percent year-over-year gain. The recovery was driven by the return of large tenants, with demand from this block increasing by 528 percent quarter-over-quarter. This resurgence, powered by the city's core Tech and Legal industries, reflects a broader national trend of large occupiers strategically consolidating into a few select markets.
The surging markets�
Markets in Focus
decline quarter-over-quarter
40%
chicago
After a standout previous quarter, Chicago's VODI collapsed by 40 percent quarter-over-quarter to 45, erasing all recent gains and leaving it down 25 percent year-over-year. The drivers of the prior surge vanished as large tenant demand evaporated - falling by 66 percent. The decline was broad and severe, impacting key sectors like Creative, Legal, and Tech, highlighting the fragility of markets lacking a dominant, secular growth driver.
Washington, D.C.
Seattle
San Francisco
New York
Los Angeles
Boston
Boston
Chicago
Los Angeles
New York
San Francisco
Seattle
Washington, D.C.
decline quarter-over-quarter
40%
chicago
After a standout previous quarter, Chicago's VODI collapsed by 40 percent quarter-over-quarter to 45, erasing all recent gains and leaving it down 25 percent year-over-year. The drivers of the prior surge vanished as large tenant demand evaporated - falling by 66 percent. The decline was broad and severe, impacting key sectors like Creative, Legal, and Tech, highlighting the fragility of markets lacking a dominant, secular growth driver.
The quarterly correction: �Chicago and New York City
Markets in Focus


