Copyright View the Space, Inc. 2025

METHODOLOGY


VTS Office
Demand Index
(VODI)

Quarterly Report
Is demand �finally thawing?
Get a pulse on what’s happening in the market today.


Read more
Read more
Read more
Read more
Pre-Pandemic
The Reset
The Crash
The Thawing
The Trough

New Demand for Office Space �Over the Pandemic: An Illustration
From January 2018 to March 2020, new office demand fluctuated around a level of 100. In some cities, there was a noticeable downward trend in advance of the pandemic: Chicago, Los Angeles, Seattle; in the other cities the VODI was more ambiguous as to whether it was flat or slightly upward trending.
Pre-Pandemic


In Spring 2020 new office demand fell sharply to the “pandemic low.” Nationally, the VODI fell from 102 in March 2020 to 16 in June 2020, a decline of 84 percent. In some cities the sharp fall was followed by a quick v-shaped rise (New York City and Los Angeles); In others, there was a prolonged u-shaped trough (Washington, D.C., San Francisco, Boston, Chicago, and Seattle).
The Crash

From June 2020 through the end of that year, new office demand generally remained very low. In some cities, such as Boston, Chicago and Washington, D.C., the VODI remained more or less flat during this period. In others, such as San Francisco and Seattle, and most notably in New York City and Chicago, this period saw new office demand begin to recover, foreshadowing the phase that was to follow.
The Trough

After vaccines were introduced in early 2021 a sense of return-to-normalcy pervaded. Nationally, the VODI rose from 33 in January 2021 to 85 in June 2021, as demand that had been waiting on the sidelines during The Trough entered the market all at once in a short period. Once that pent-up demand was spent, the VODI quickly subsided from 87 in August 2021 to 61 in October 2021. Although cities whose economies are more remote work-friendly exhibited substantially lower levels of new office demand, all cities experienced a reset.
The Reset

Since October 2021 the VODI has been seemingly stagnant. It trended downward slightly in the earlier part of the period, and bottomed out in late-2022 and early-2023. Since then, it has slow v beaun aainina new momentum.
The Thawing

Explore nationwide trends
National VODI results: Demand finds stability amidst a mixed economy
NATIONAL


SEE LOCAL TRENDS
View impact on VODI
The tech sector, which has been the most resistant to returning to the office, seems to be shifting towards a more favorable view of on-site work.

KEY TAKEAWAYS
NATIONAL TRENDS
LOCAL TRENDS
METHODOLOGY
COMPANY


Read more
National
Local
KEY TAKEAWAYS FROM THIS REPORT
NEXT
VTS Office
Demand Index
(VODI)
QUARTERLY REPORT
July 2025
The VODI softened in Q1 2025. Although the index ended the quarter at 68—up a modest 4.6% from a year earlier—that figure masks declines in January and February that ended a 20-month streak of year-over-year growth.
NATIONAL
The first quarter of 2025, however, showed uneven movement:
SEE MORE NATIONAL TRENDS
NATIONAL
From January 2018 to March 2020, new office demand fluctuated around a level of 100. In some cities, there was a noticeable downward trend in advance of the pandemic: Chicago, Los Angeles, Seattle; in the other cities the VODI was more ambiguous as to whether it was flat or slightly upward trending.
Pre-Pandemic
In Spring 2020 new office demand fell sharply to the “pandemic low.” Nationally, the VODI fell from 102 in March 2020 to 16 in June 2020, a decline of 84 percent. In some cities the sharp fall was followed by a quick v-shaped rise (New York City and Los Angeles); In others, there was a prolonged u-shaped trough (Washington, D.C., San Francisco, Boston, Chicago, and Seattle).
The Crash
From June 2020 through the end of that year, new office demand generally remained very low. In some cities, such as Boston, Chicago, and Washington, D.C., the VODI remained more or less flat during this period. In others, such as San Francisco and Seattle, and most notably in New York City and Chicago, this period saw new office demand begin to recover, foreshadowing the phase that was to follow.
The Trough
After vaccines were introduced in early 2021 a sense of return-to-normalcy pervaded. Nationally, the VODI rose from 33 in January 2021 to 85 in June 2021, as demand that had been waiting on the sidelines during The Trough entered the market all at once in a short period. Once that pent-up demand was spent, the VODI quickly subsided from 87 in August 2021 to 61 in October 2021. Although cities whose economies are more remote work-friendly exhibited substantially lower levels of new office demand, all cities experienced a reset.
The Reset
Since October 2021 the VODI has been seemingly stagnant. It trended downward slightly in the earlier part of the period, and bottomed out in late-2022 and early-2023. Since then, it has slowly begun gaining new momentum.
The Thawing
Read VODI impacts on local markets
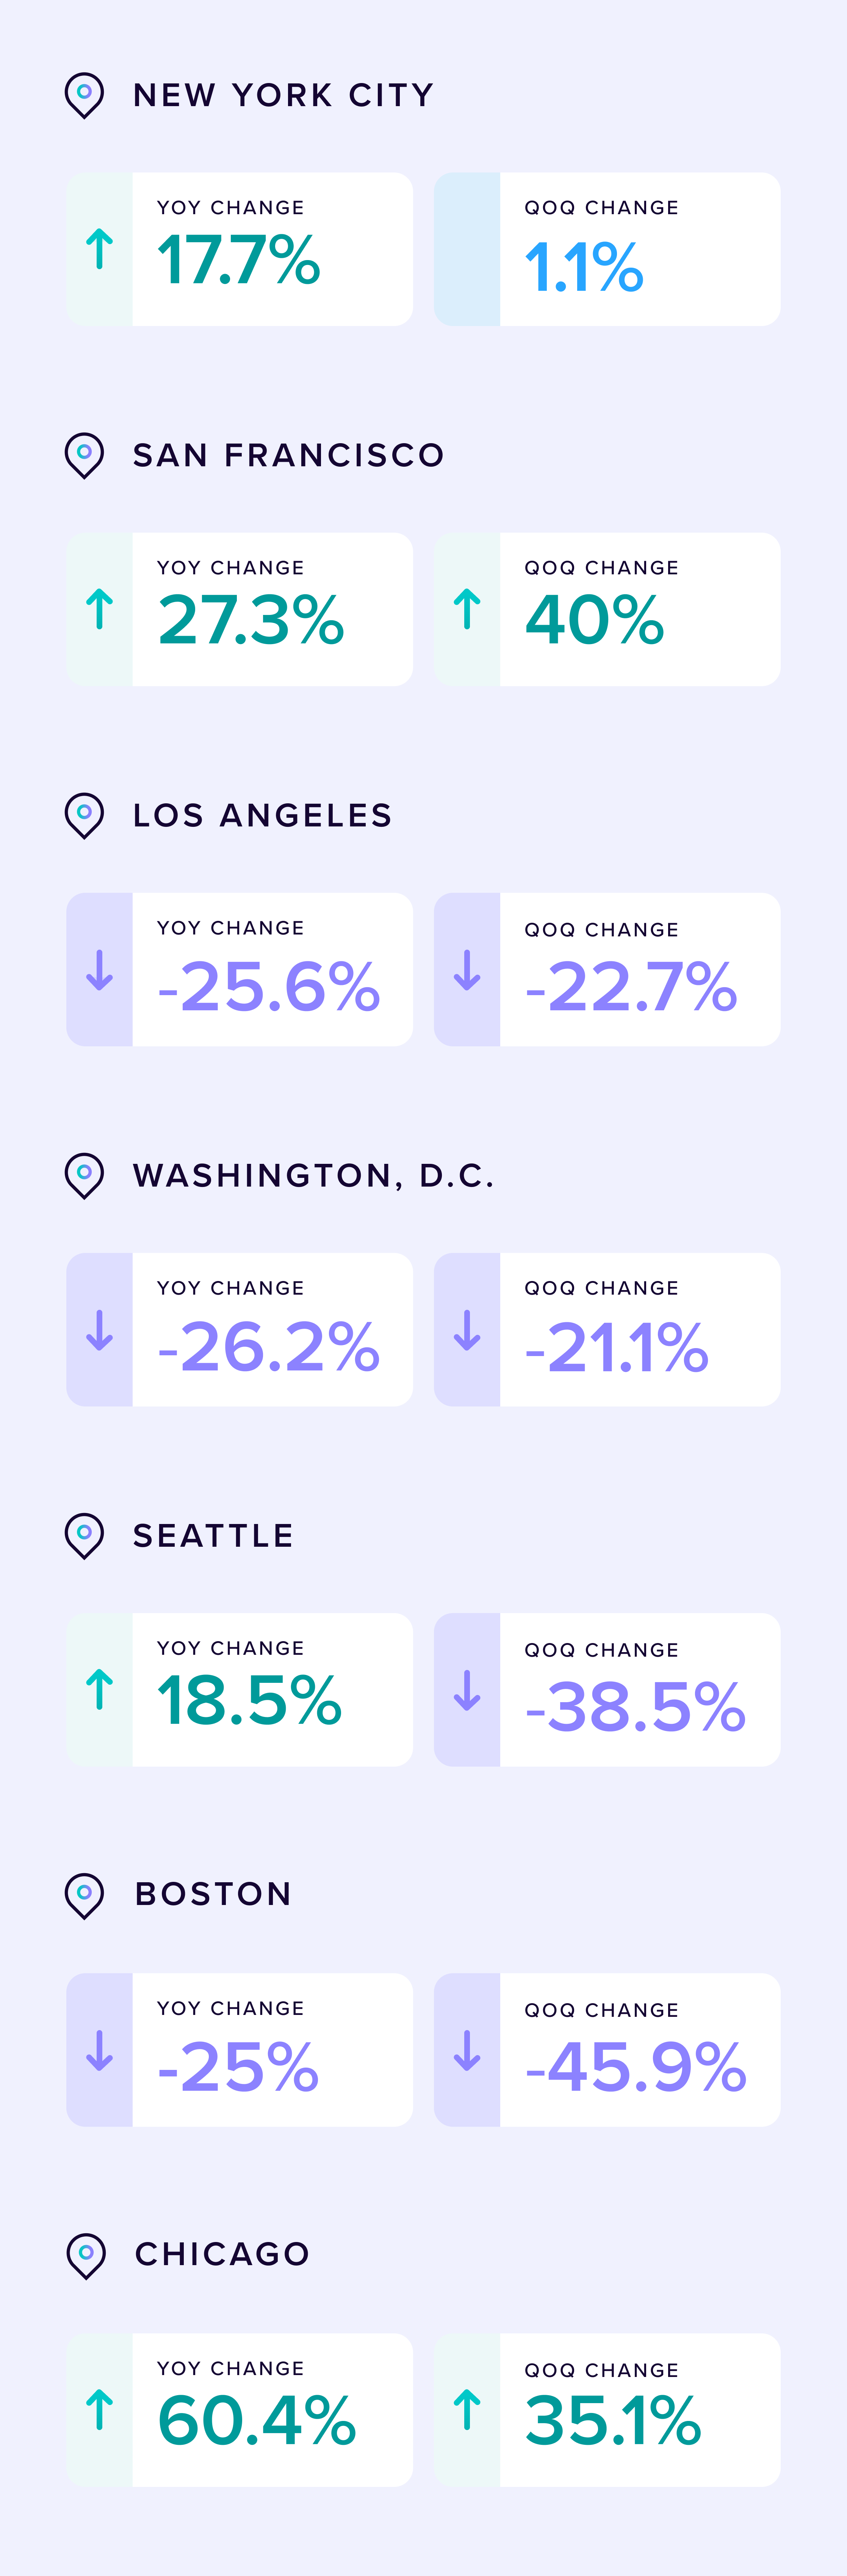
5 of the 7 cities tracked saw year-over-year increases in the VODI.
LOCAL
Read more local VODI trends
Get a pulse on what’s happening in the market today.
Copyright View the Space, Inc. 2025
BACK TO TOP
METHODOLOGY


National
Local
KEY TAKEAWAYS FROM THIS REPORT
A sharp divergence has emerged among major U.S. office markets. While some markets are showing strong annual growth, some are also experiencing a steep quarterly deceleration.
PREVIOUS

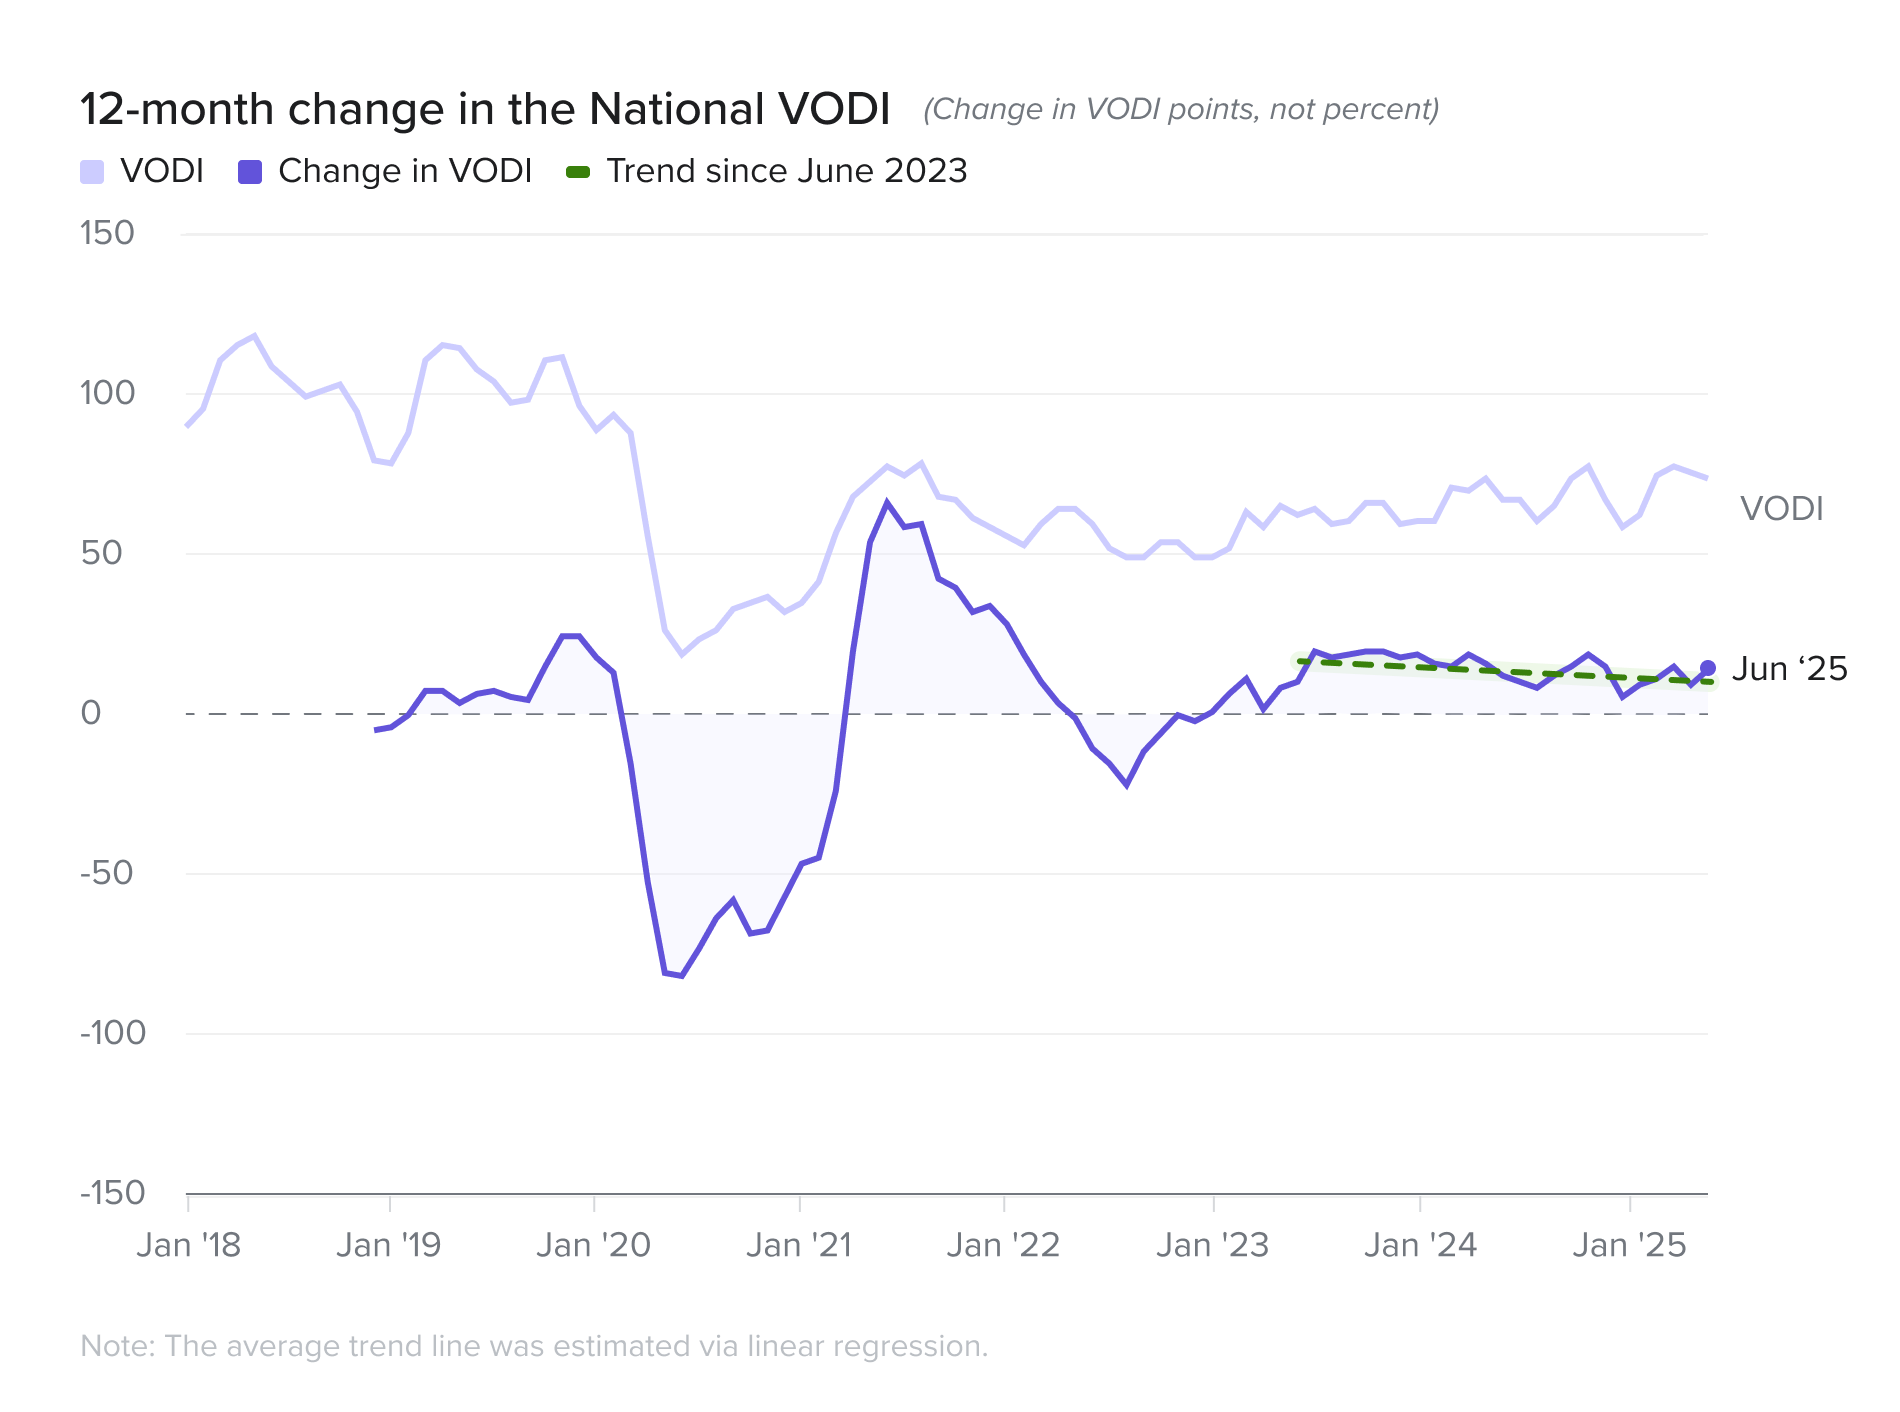
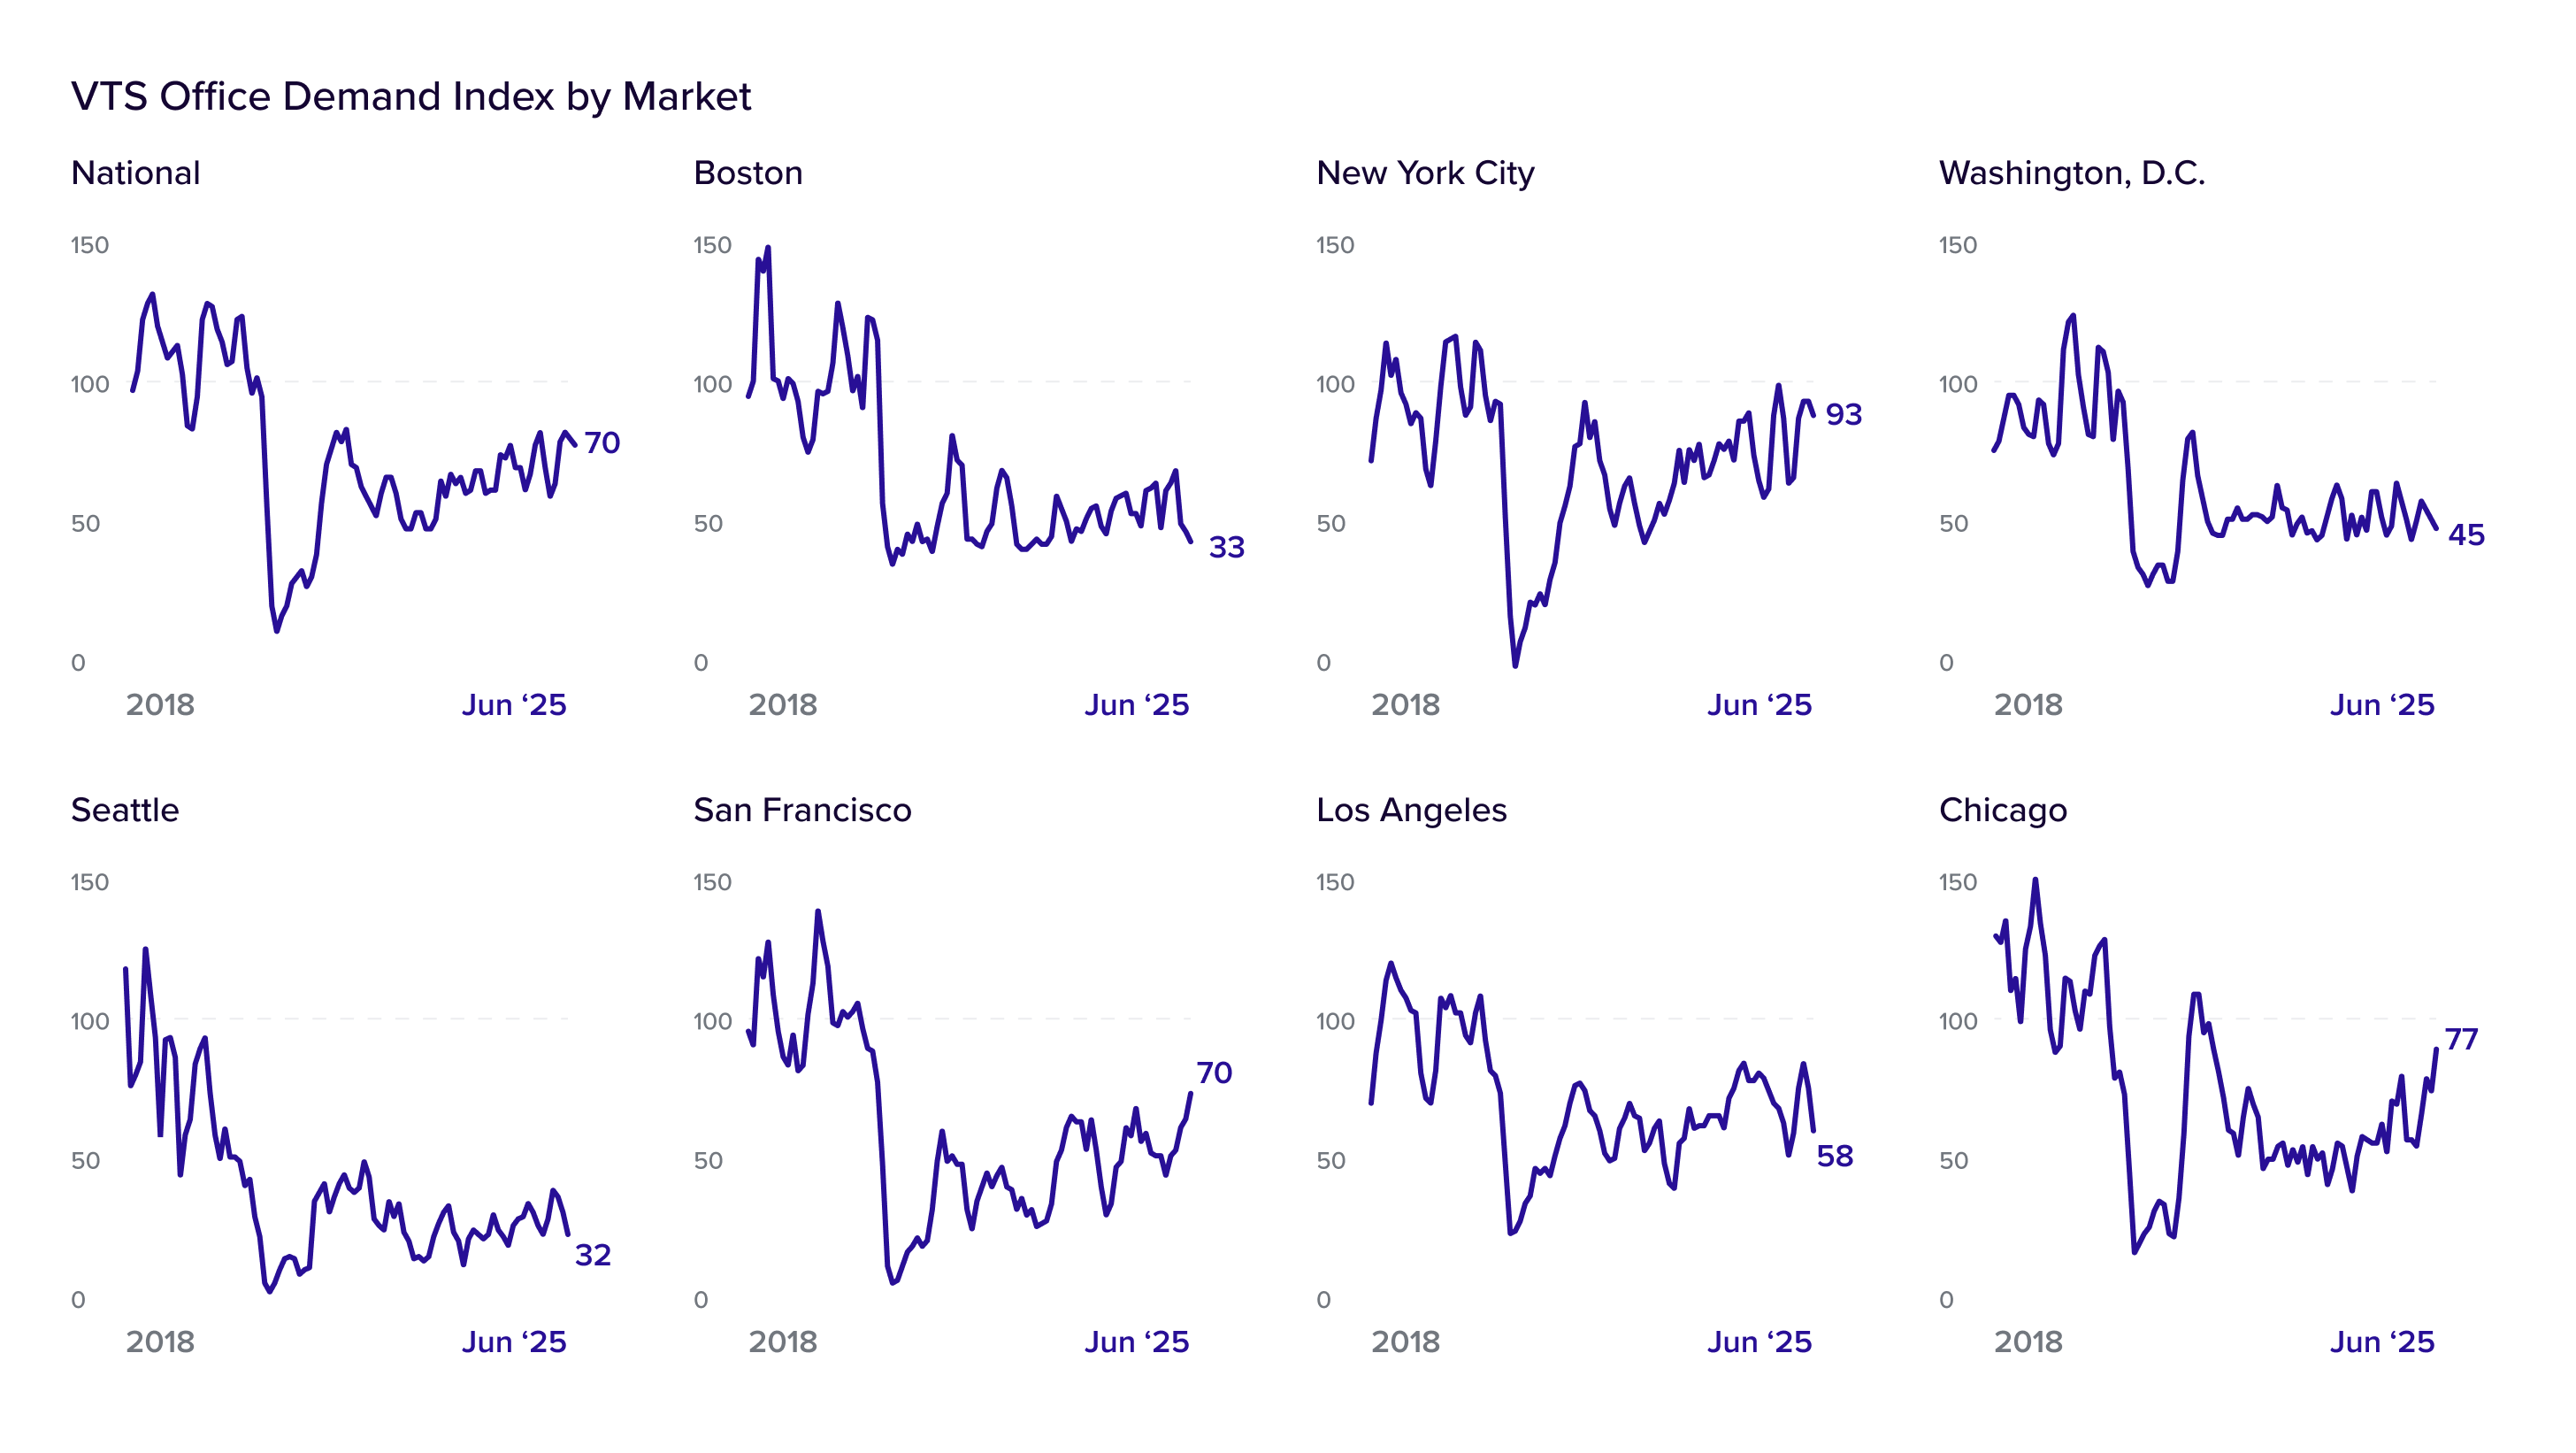
The national VTS Office Demand Index (VODI) held steady in the second quarter, ending June 2025 at a VODI of 70. This represents a strong 11.1 percent year-over-year increase from June 2024's reading of 63. There was a slight 1.4 percent decline from March 2025 as uncertainty from global trade policy, potential and realized impacts of AI (both positive and negative), and international conflicts took their toll and stalled momentum.
April 2025

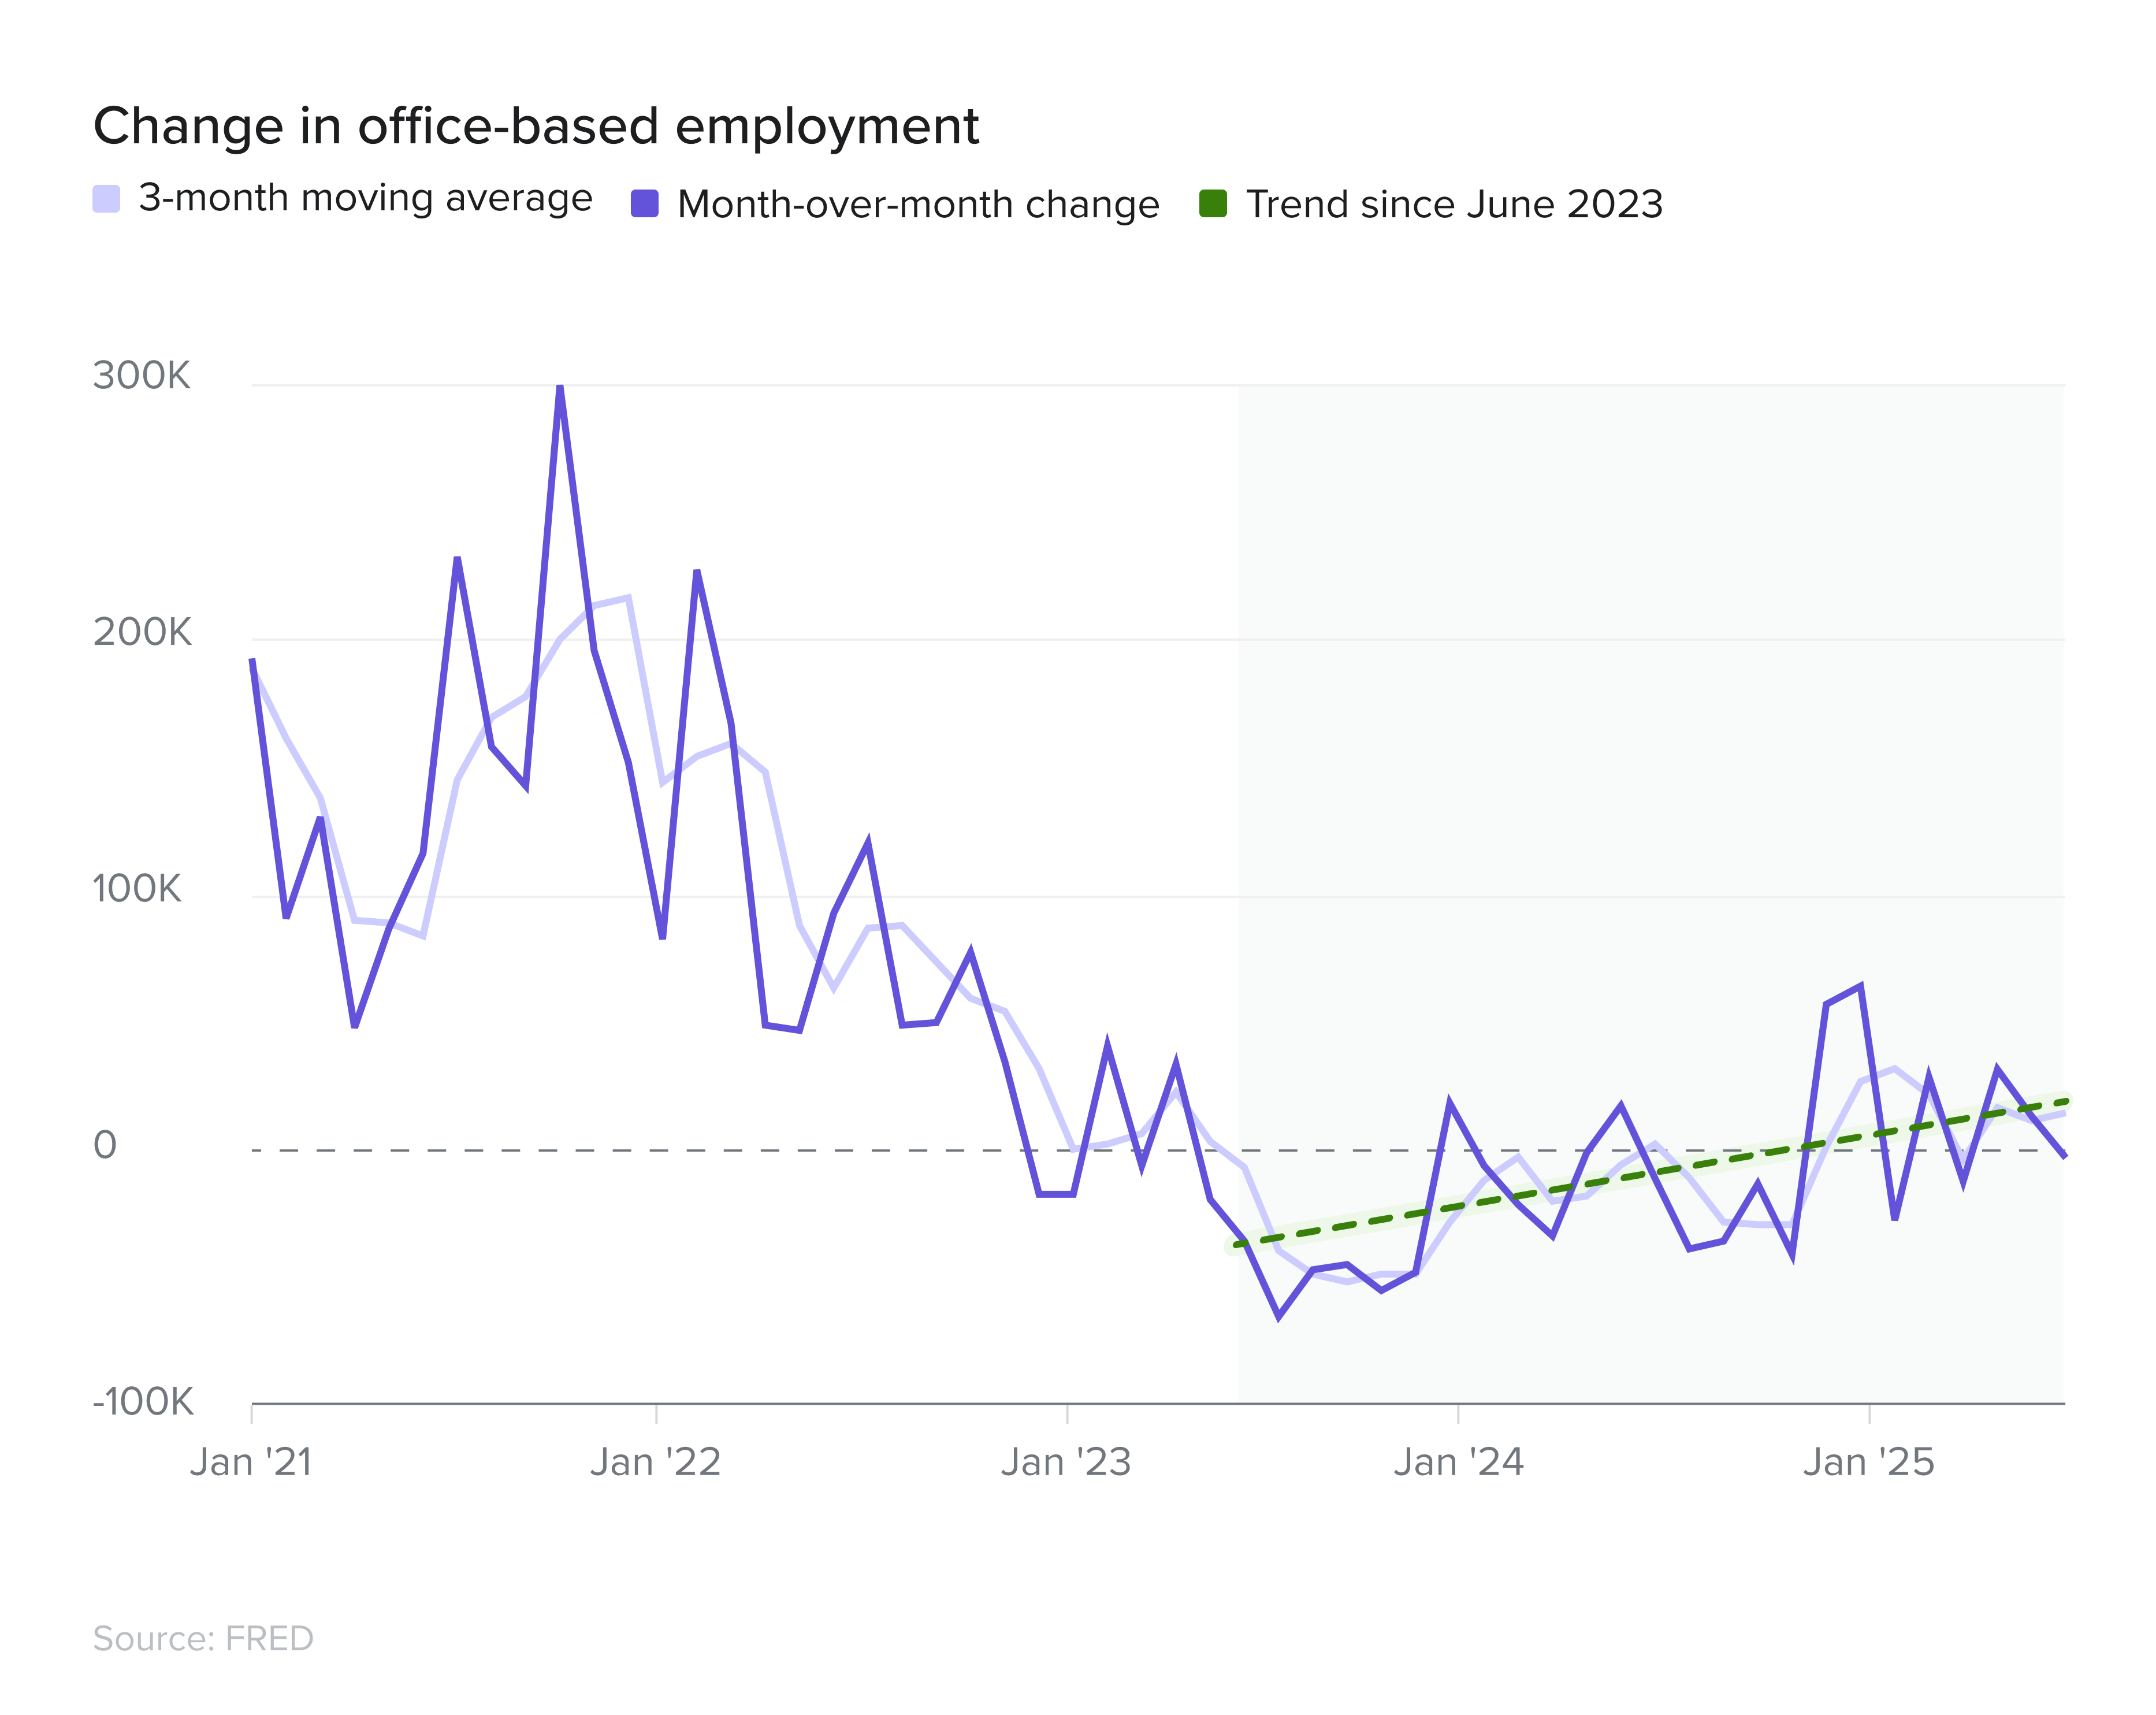
The labor market presented a mixed picture in Q2. While the index of job postings continued to cool, declining by 2.4 percent over the quarter, office-using employment ended its prior contraction in Q1 as 47,000 new office-using jobs were added in Q2. While this pace is above the trailing 3-month average over the last year, it’s below the 100k+ pace seen pre-pandemic and in the post-pandemic recovery. Remote work saw a slight reversal from its long-term decline at the end of Q2. The share of job searches for remote roles was down 270 bps from the peaks in early-2023 to May 2025. Remote postings increased 30 bps in June 2025.
Read more
Read more
Read more
Read more
Read more
Pre-Pandemic
The Reset
The Crash
The Recovery
The Trough

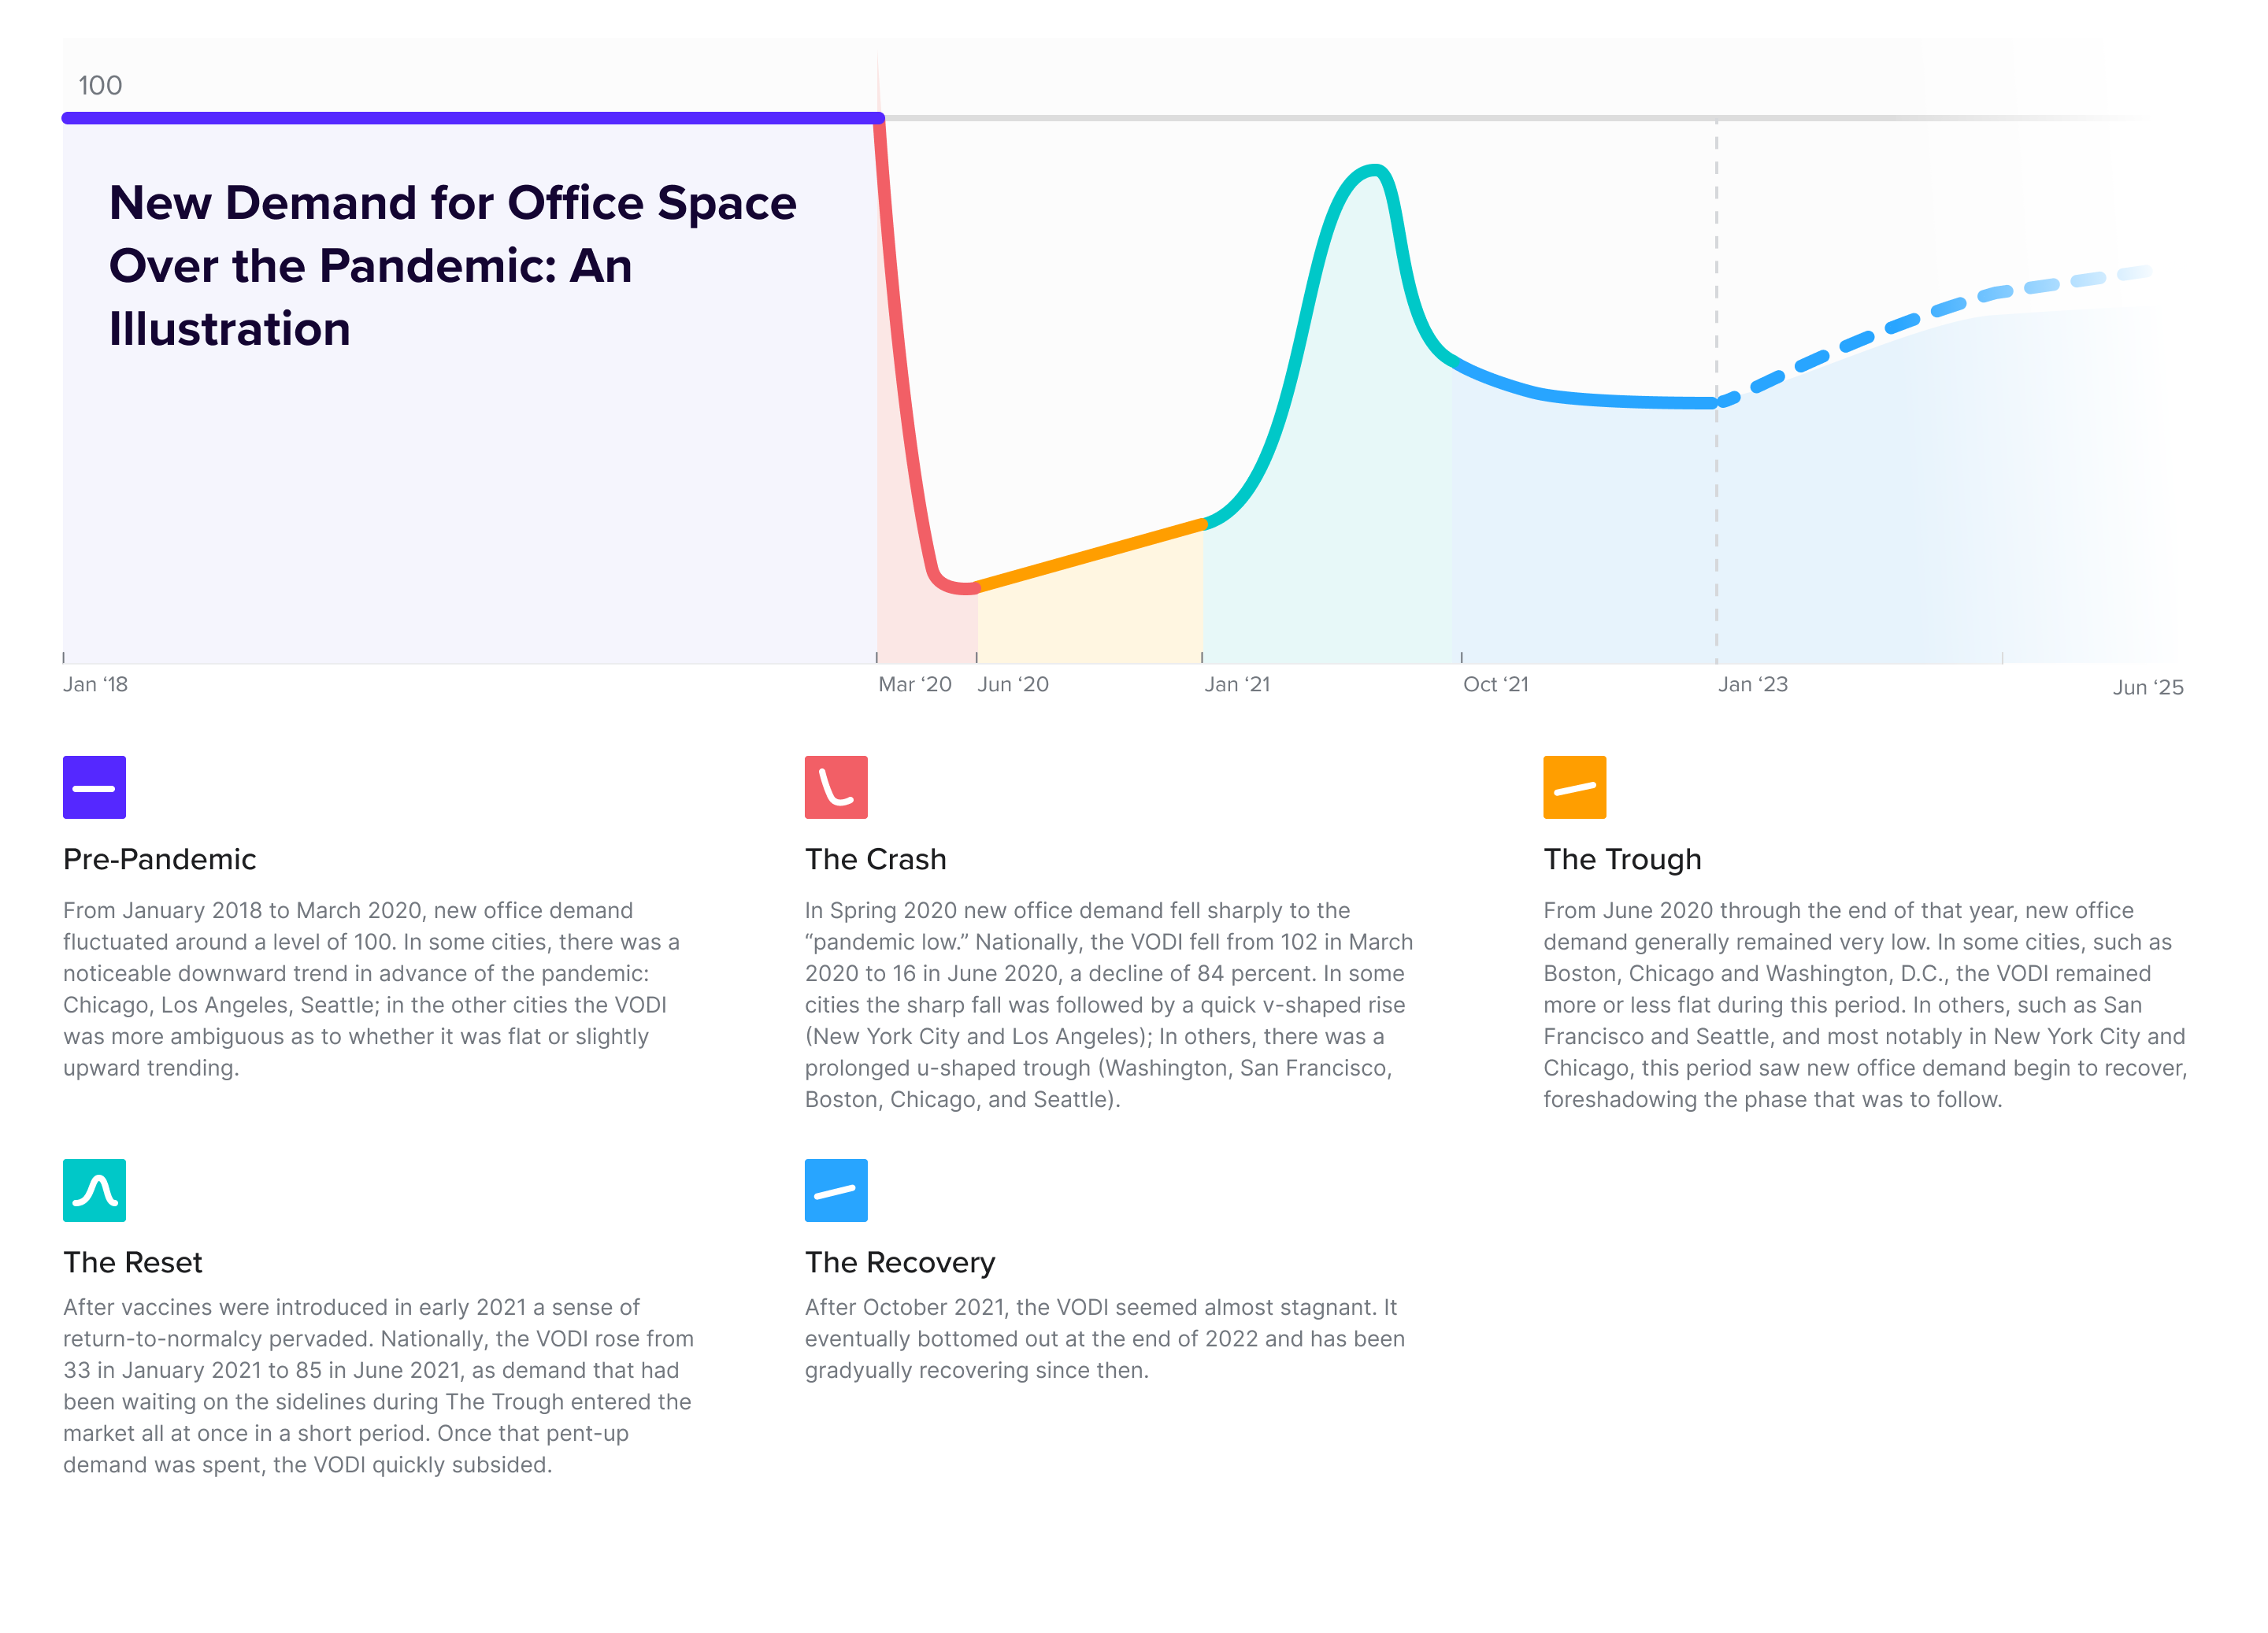
New Demand for Office Space �Over the Pandemic: An Illustration
Is demand �finally thawing?
From January 2018 to March 2020, new office demand fluctuated around a level of 100. In some cities, there was a noticeable downward trend in advance of the pandemic: Chicago, Los Angeles, Seattle; in the other cities the VODI was more ambiguous as to whether it was flat or slightly upward trending.
Pre-Pandemic
In Spring 2020 new office demand fell sharply to the “pandemic low.” Nationally, the VODI fell from 102 in March 2020 to 16 in June 2020, a decline of 84 percent. In some cities the sharp fall was followed by a quick v-shaped rise (New York City and Los Angeles); In others, there was a prolonged u-shaped trough (Washington, San Francisco, Boston, Chicago, and Seattle).
The Crash
From June 2020 through the end of that year, new office demand generally remained very low. In some cities, such as Boston, Chicago and Washington, D.C., the VODI remained more or less flat during this period. In others, such as San Francisco and Seattle, and most notably in New York City and Chicago, this period saw new office demand begin to recover, foreshadowing the phase that was to follow.
The Trough
After vaccines were introduced in early 2021 a sense of return-to-normalcy pervaded. Nationally, the VODI rose from 33 in January 2021 to 85 in June 2021, as demand that had been waiting on the sidelines during The Trough entered the market all at once in a short period. Once that pent-up demand was spent, the VODI quickly subsided.
The Reset
After October 2021, the VODI seemed almost stagnant. It eventually bottomed out at the end of 2022 and has been gradually recovering since then.
The Recovery
Dec 2022
VODI

46
Dec 2023
55
Dec 2024
64
VODI has risen substantially during the last two years
What the VODI reflects:
The VODI measures the pace at which new office space requirements, adjusted for market size, enter the pool of active demand. A reading of 100 indicates that new requirements are flowing in at the same average pace as during 2018-2019. The VODI reflects only the rate at which office space is likely to fill—not how it may empty out or change due to supply fluctuations.
While the VODI tracks growth in new demand, office occupancy reflects the proportion of office space currently in use. Even if the VODI reaches 100 and soon after active demand quickly recovers to pre-pandemic levels, this simply means that offices will likely fill at the same pace as before the pandemic—but it could still take a long time for occupancy to return to pre-pandemic levels. The pandemic caused a sharp decline in occupancy, and recovery of the VODI does not mean that the gap left by that drop has been filled—only that the pace of filling has recovered.
How the VODI differs from occupancy:
Occupancy is further shaped by the overall supply of office space, which fluctuates as buildings are constructed, demolished, or repurposed. Currently, minimal new office construction and modest conversions of office buildings to residential or other uses are slightly helping to boost occupancy rates.
The role of office supply:
The increase in new demand for office space – even amid a cooling labor market – reflects growing clarity around hybrid and remote work norms, giving employers more confidence to pursue their office space needs.
However, the TAMI sector continues to defy this trend, maintaining a stronger aversion to in-person work than other office-using industries.
•
�
�
•

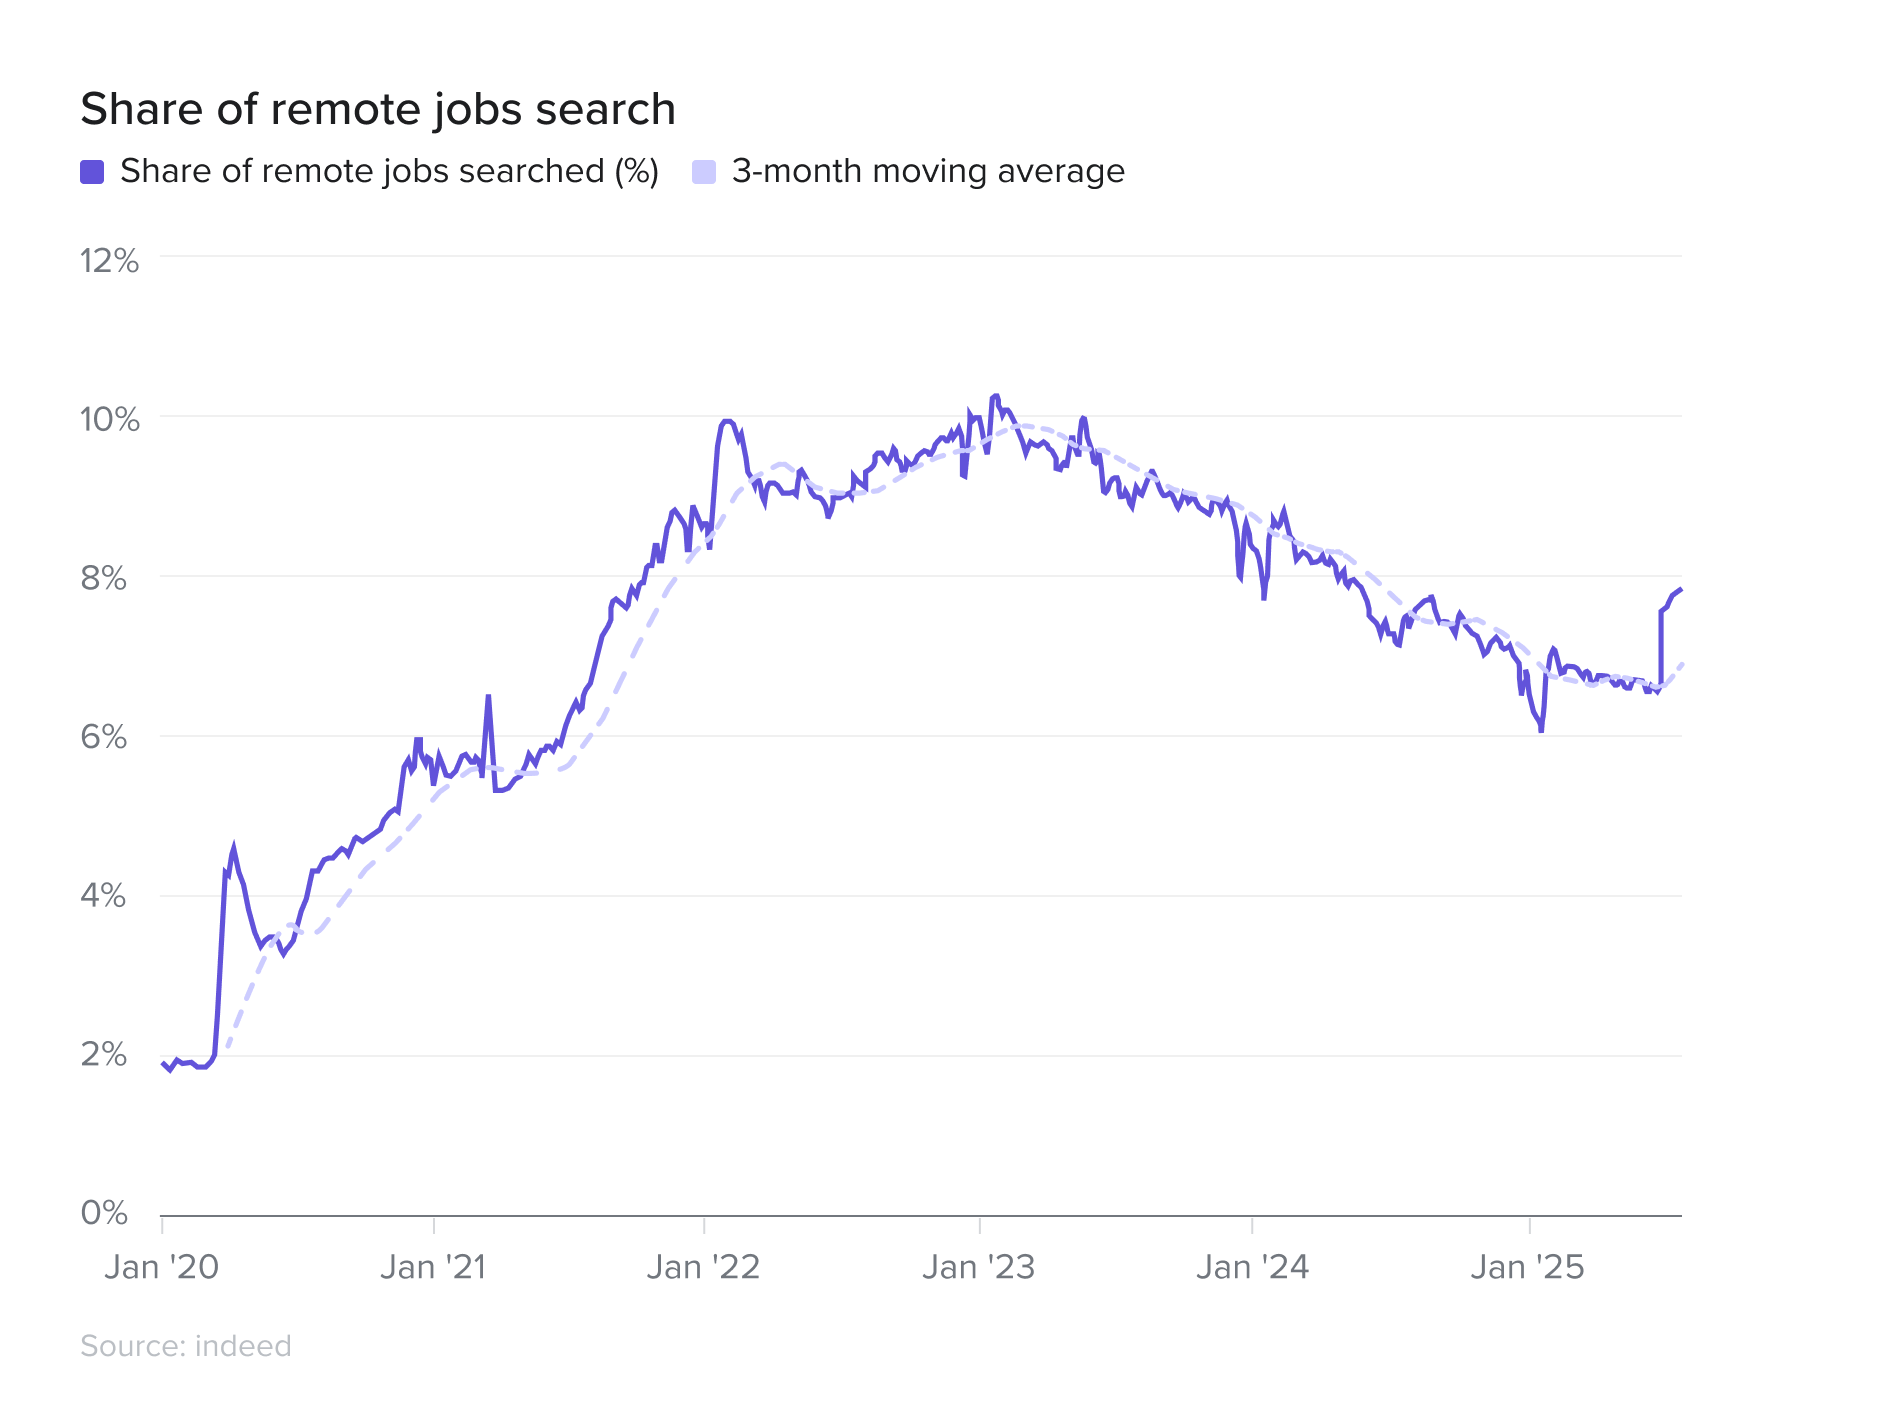
The "push and pull" between employers and employees over remote work saw a surprising slight reversal in the second quarter. After a three year decline, the share of job searches for remote work increased from 6.7 percent to 7.8 percent during the second quarter - the third highest quarterly increase - only behind the increases in Q3 2021 and Q1 2020. This implies employer leverage in the push for a return-to-office is more nuanced and less linear than is commonly thought.
View impact on VODI
Learn more about VTS Data
See VODI Methodology
Explore nationwide trends
The national VODI closed the year 16.4 percent higher than a year ago and 39.1 percent higher than two years ago.
At this pace of growth, it would take approximately four more years for the VODI to reach a level of 100 in December.
•
��•
Read more
Pre-Pandemic
Read more
The Crash
Read more
The Trough
Read more
The Reset
Read more
The Thawing
Could we be at
inflection point?
Jan '18
Mar '20
Jun '20
Oct '21
Jan '23
Jan '21
Mar '25
New Demand for Office Space Over the Pandemic: An Illustration
From January 2018 to March 2020, new office demand fluctuated around a level of 100. In some cities, there was a noticeable downward trend in advance of the pandemic: Chicago, Los Angeles, Seattle; in the other cities the VODI was more ambiguous as to whether it was flat or slightly upward trending.
Pre-Pandemic
In Spring 2020 new office demand fell sharply to the “pandemic low.” Nationally, the VODI fell from 102 in March 2020 to 16 in June 2020, a decline of 84 percent. In some cities the sharp fall was followed by a quick v-shaped rise (New York City and Los Angeles); In others, there was a prolonged u-shaped trough (Washington, D.C., San Francisco, Boston, Chicago, and Seattle).
The Crash
From June 2020 through the end of that year, new office demand generally remained very low. In some cities, such as Boston, Chicago, and Washington, D.C., the VODI remained more or less flat during this period. In others, such as San Francisco and Seattle, and most notably in New York City and Chicago, this period saw new office demand begin to recover, foreshadowing the phase that was to follow.
The Trough
After vaccines were introduced in early 2021 a sense of return-to-normalcy pervaded. Nationally, the VODI rose from 33 in January 2021 to 85 in June 2021, as demand that had been waiting on the sidelines during The Trough entered the market all at once in a short period. Once that pent-up demand was spent, the VODI quickly subsided from 87 in August 2021 to 61 in October 2021. Although cities whose economies are more remote work-friendly exhibited substantially lower levels of new office demand, all cities experienced a reset.
The Reset
Since October 2021 the VODI has been seemingly stagnant. It trended downward slightly in the earlier part of the period, and bottomed out in late-2022 and early-2023. Since then, it has slowly begun gaining new momentum.
The Thawing

The national VODI closed the year 16.4 percent higher than a year ago and 39.1 percent higher than two years ago.
At this pace of growth, it would take approximately four more years for the VODI to reach a level of 100 in December.
•
��•
Explore nationwide trends
In addition, recent gyrations in new U.S. trade policy have heightened economic uncertainty. Uncertainty typically prompts caution, leading employers to delay hiring and related commitments, such as signing new office leases.
While a cooling labor market normally weakens office demand, the current situation is more complex. We’re still in the midst of a broad return-to-office trend following the COVID-19 pandemic. As the labor market cools, employers gain bargaining power, enabling them to push for more on-site work, which helps offset the drag on office demand.
The sectoral mix of new office demand highlights this offsetting effect. The FIRE sector’s share of new office demand dropped sharply in Q1, falling from 31.9 percent of square footage in November 2024 to just 20.8 percent in March 2025. This sector tends to be more sensitive to shifts in financial conditions and was already among the most advanced in returning to the office, leaving less room for further on-site gains to counterbalance labor market weakness.
Explore nationwide trends
Read VODI impacts on local markets
See VODI Methodology


Headline office demand growth was stable in Q2 2025, masking underlying volatility across markets. The National VTS Office Demand Index (VODI) ended June at a level of 70, 11.1 percent higher than the VODI of 63 recorded in June 2024. The index was flat quarter-over-quarter, down 1.4 percent from 71 in March 2025, as uncertainty abounded from a changing landscape in global trade policy, geopolitical escalations, and as office-using firms try to establish the short- and long-term impacts of AI on productivity and the workforce.
�
The national VODI closed the year 16.4 percent higher than a year ago and 39.1 percent higher than two years ago.
At this pace of growth, it would take approximately four more years for the VODI to reach a level of 100 in December.
•
��•
The increase in new demand for office space – even amid a cooling labor market – reflects growing clarity around hybrid and remote work norms, giving employers more confidence to pursue their office space needs.
However, the TAMI sector continues to defy this trend, maintaining a stronger aversion to in-person work than other office-using industries.


increase from a year ago
22.7%
WASHINGTON, D.C.
BOSTON AND SEATTLE
increase from a year ago
22.7%
BOSTON
National
Explore nationwide trends
NEXT
NATIONAL
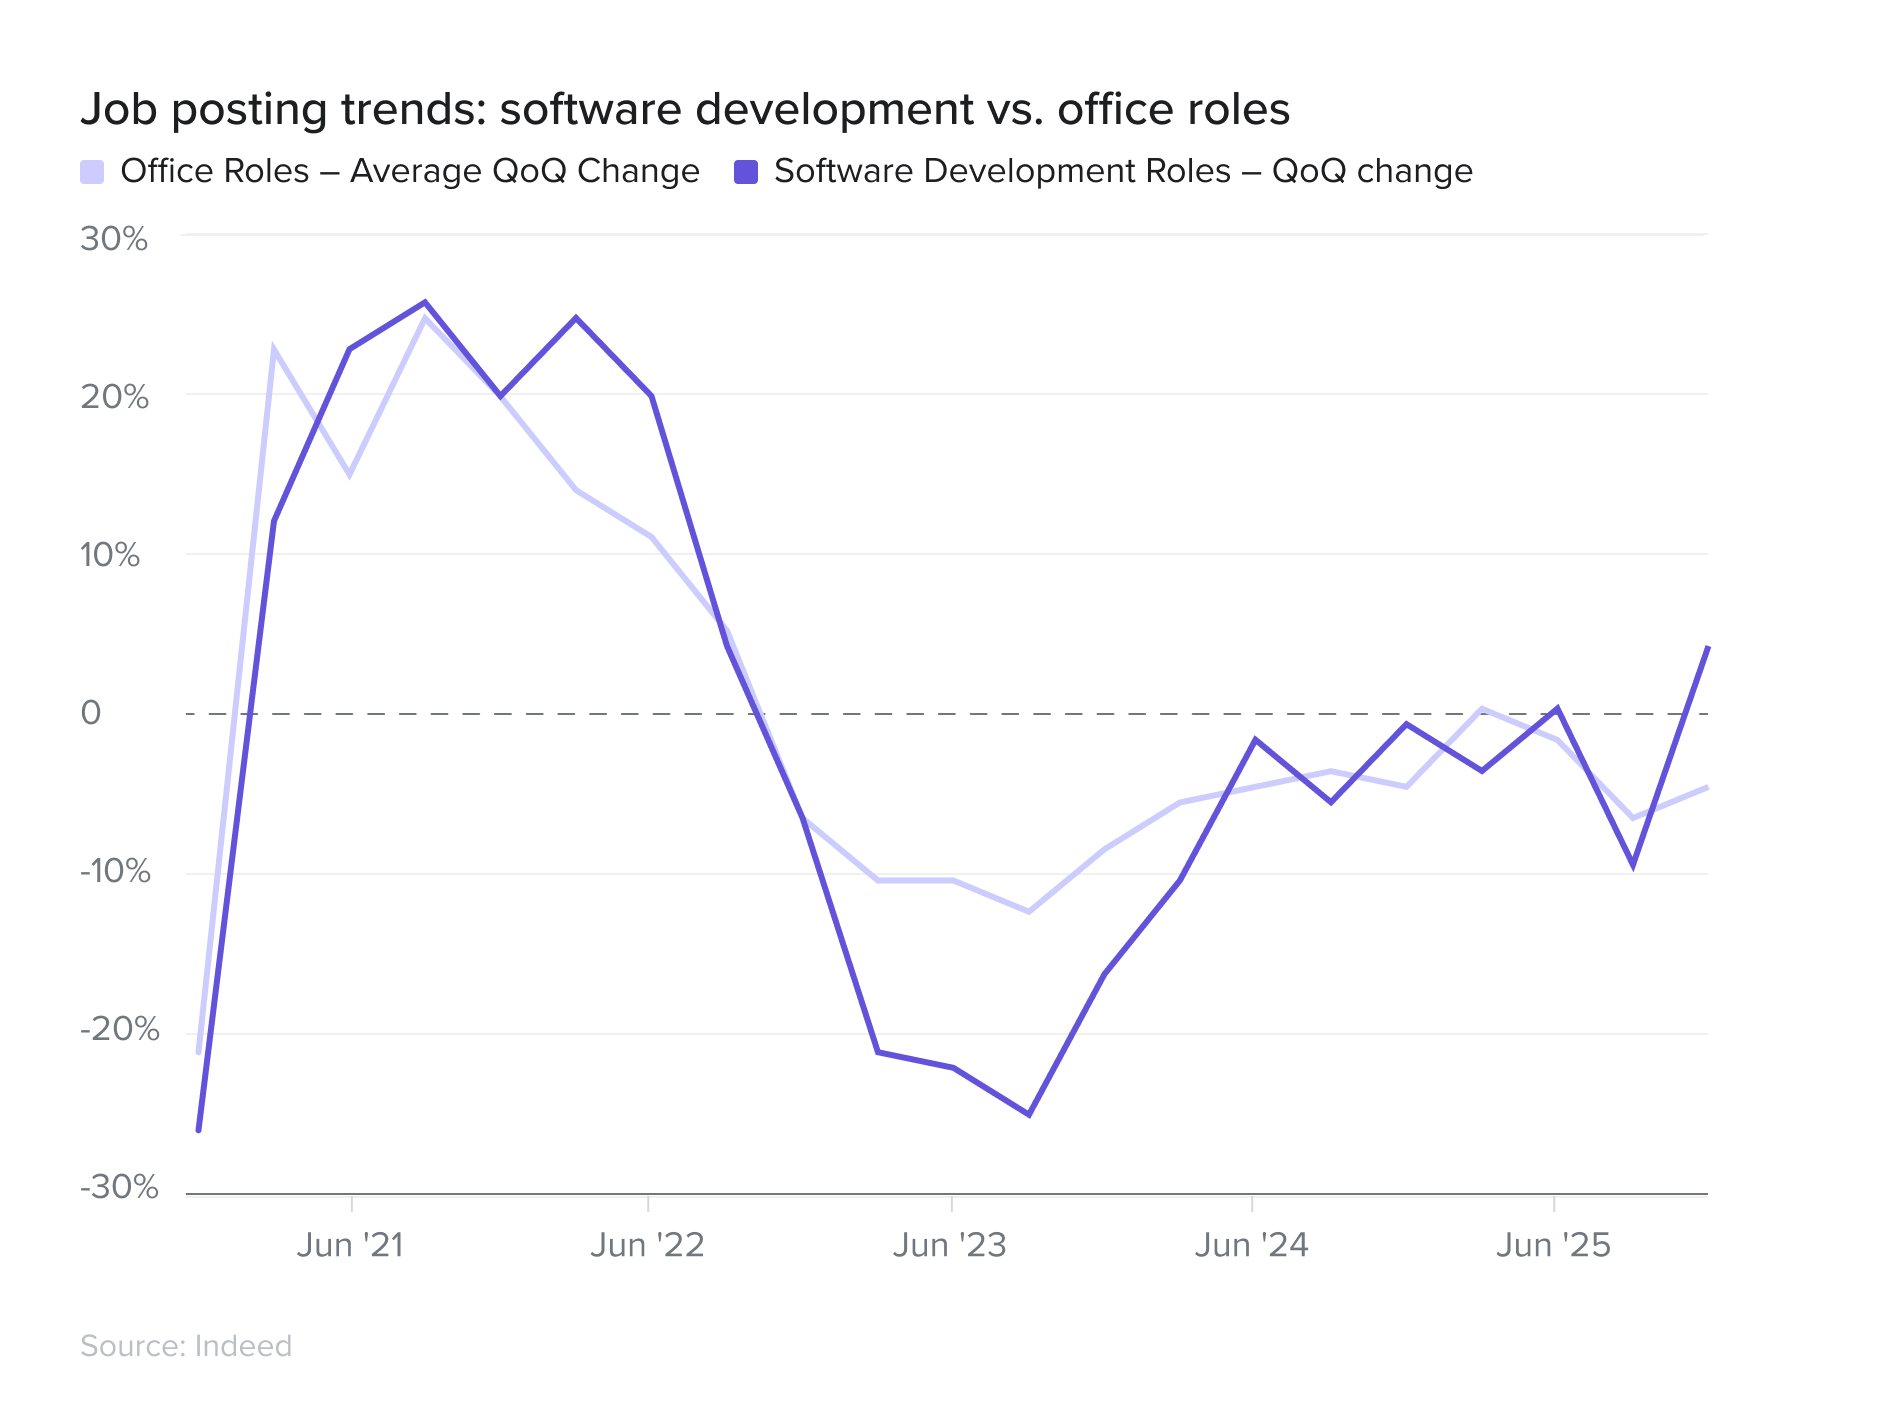
Stability in the VODI comes amidst a complex economic backdrop. The broader labor market has continued to show signs of cooling, with the Indeed Job Postings Index falling 2.4 percent from the end of March to the end of June to the lowest reading recorded in the post-pandemic period. The only office-using segment to see noticeable quarter-over-quarter gains in Indeed job postings was the Software Development sector, although it was down 7 percent year-over-year. This high-level trend masks a more optimistic story within office-using professions. After a period of decline in office-using employment starting in early-2023, office-using jobs grew in Q2 with the addition of 47k new jobs.
Read VODI impacts on local markets
Read VODI impacts on local markets
Local VODI results: A great divergence in market fortunes
�
The second quarter of 2025 revealed a dramatic divergence in the performance of major U.S. office markets. While the year-over-year picture shows clear winners and losers, a quarter-over-quarter analysis reveals significant volatility, with some markets experiencing a steep quarterly deceleration.
Read VODI impacts on local markets
LOCAL


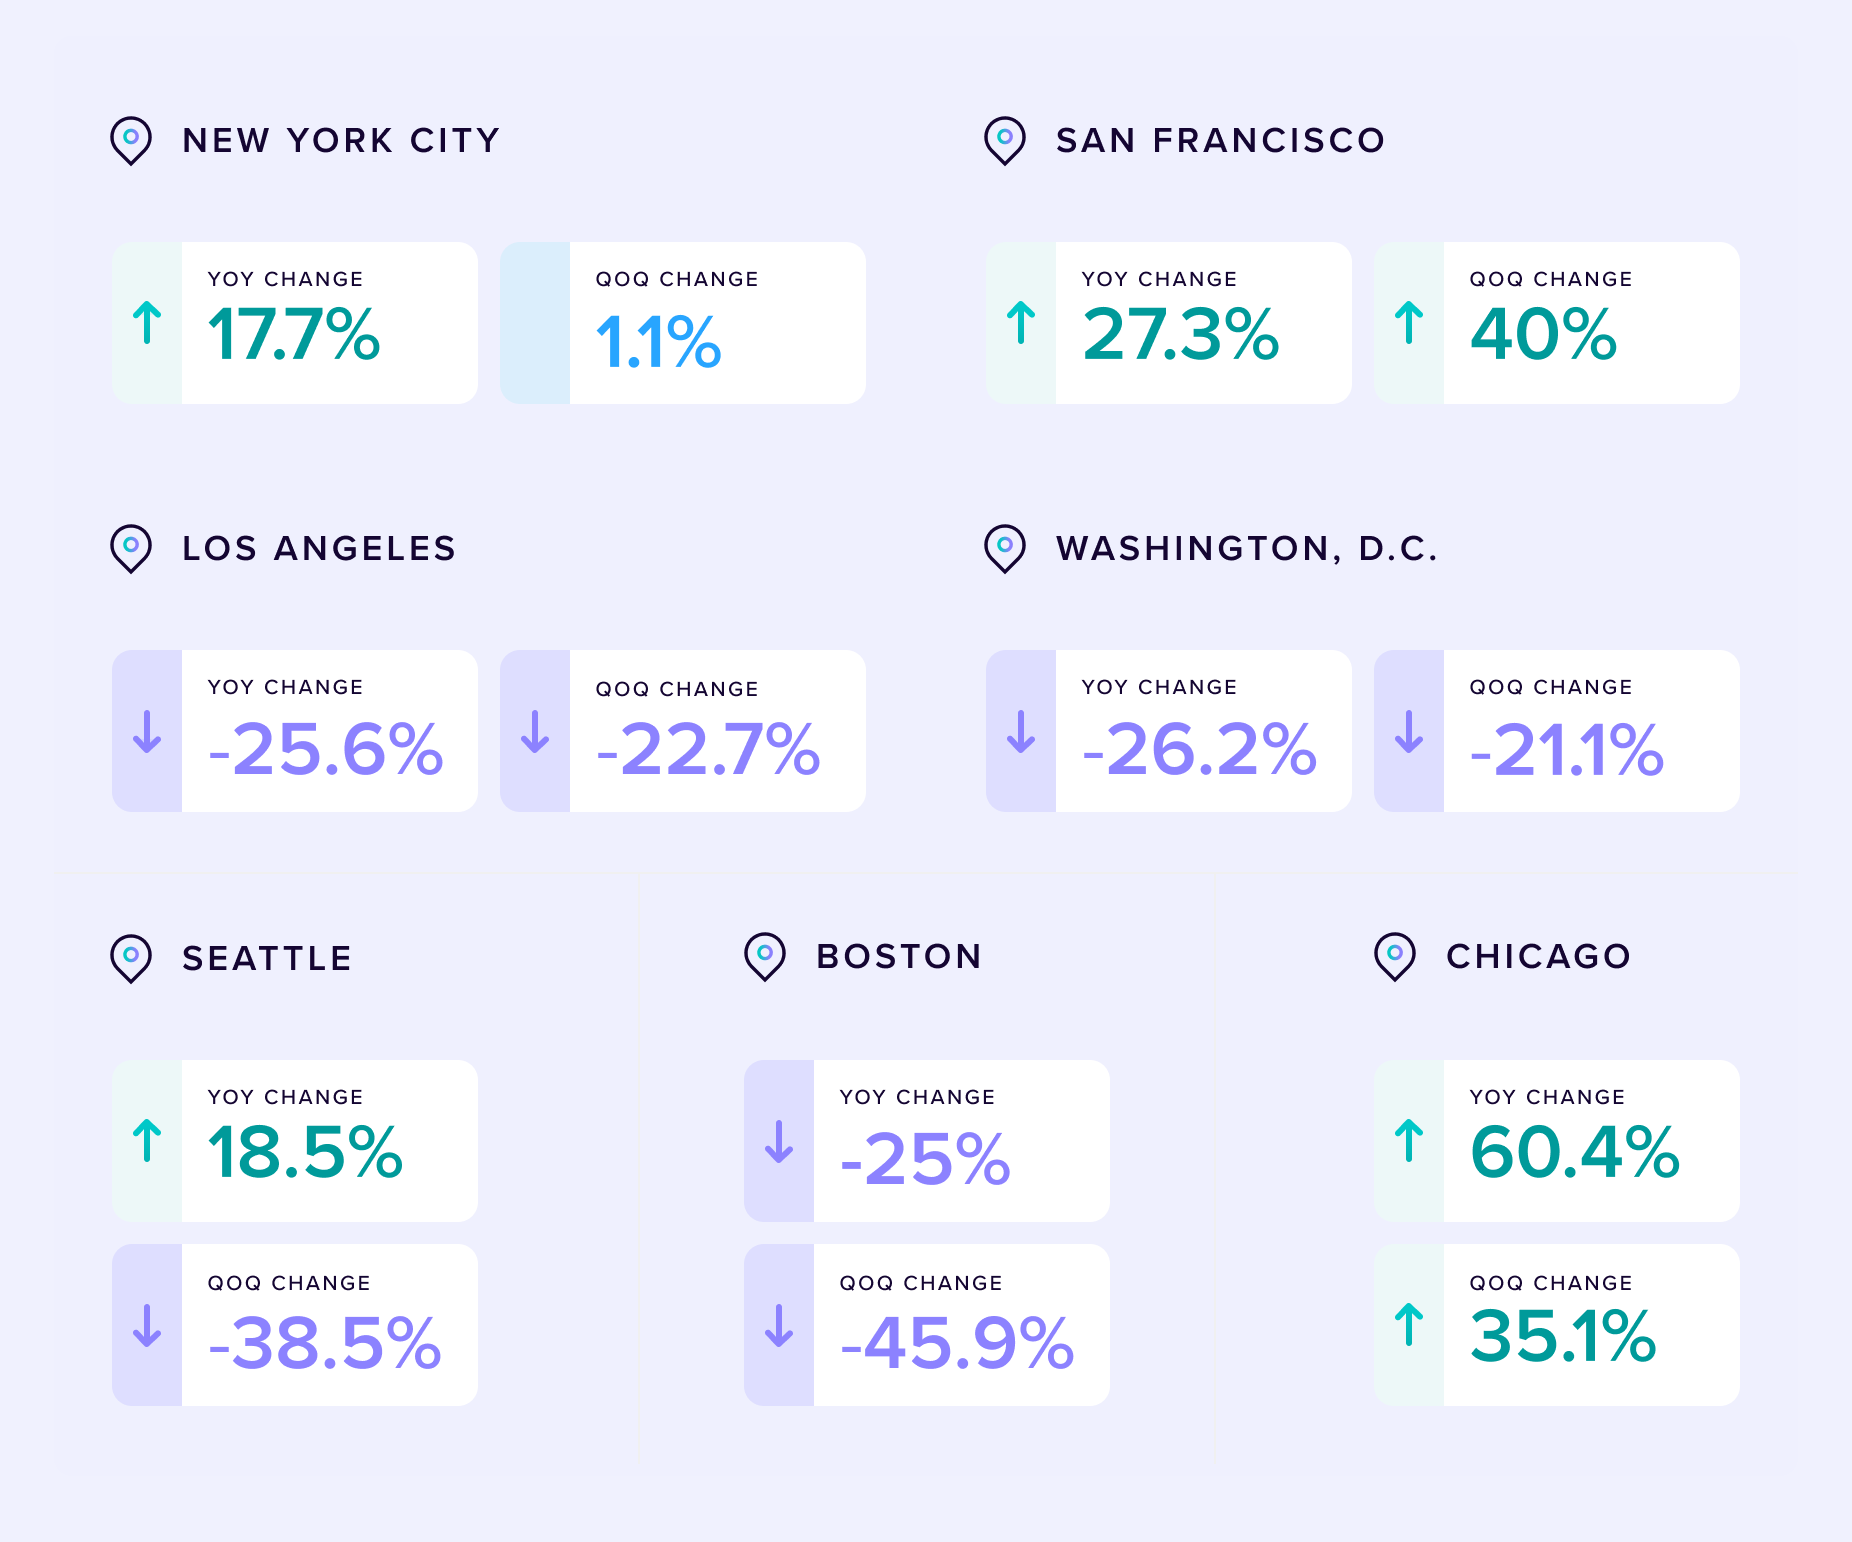
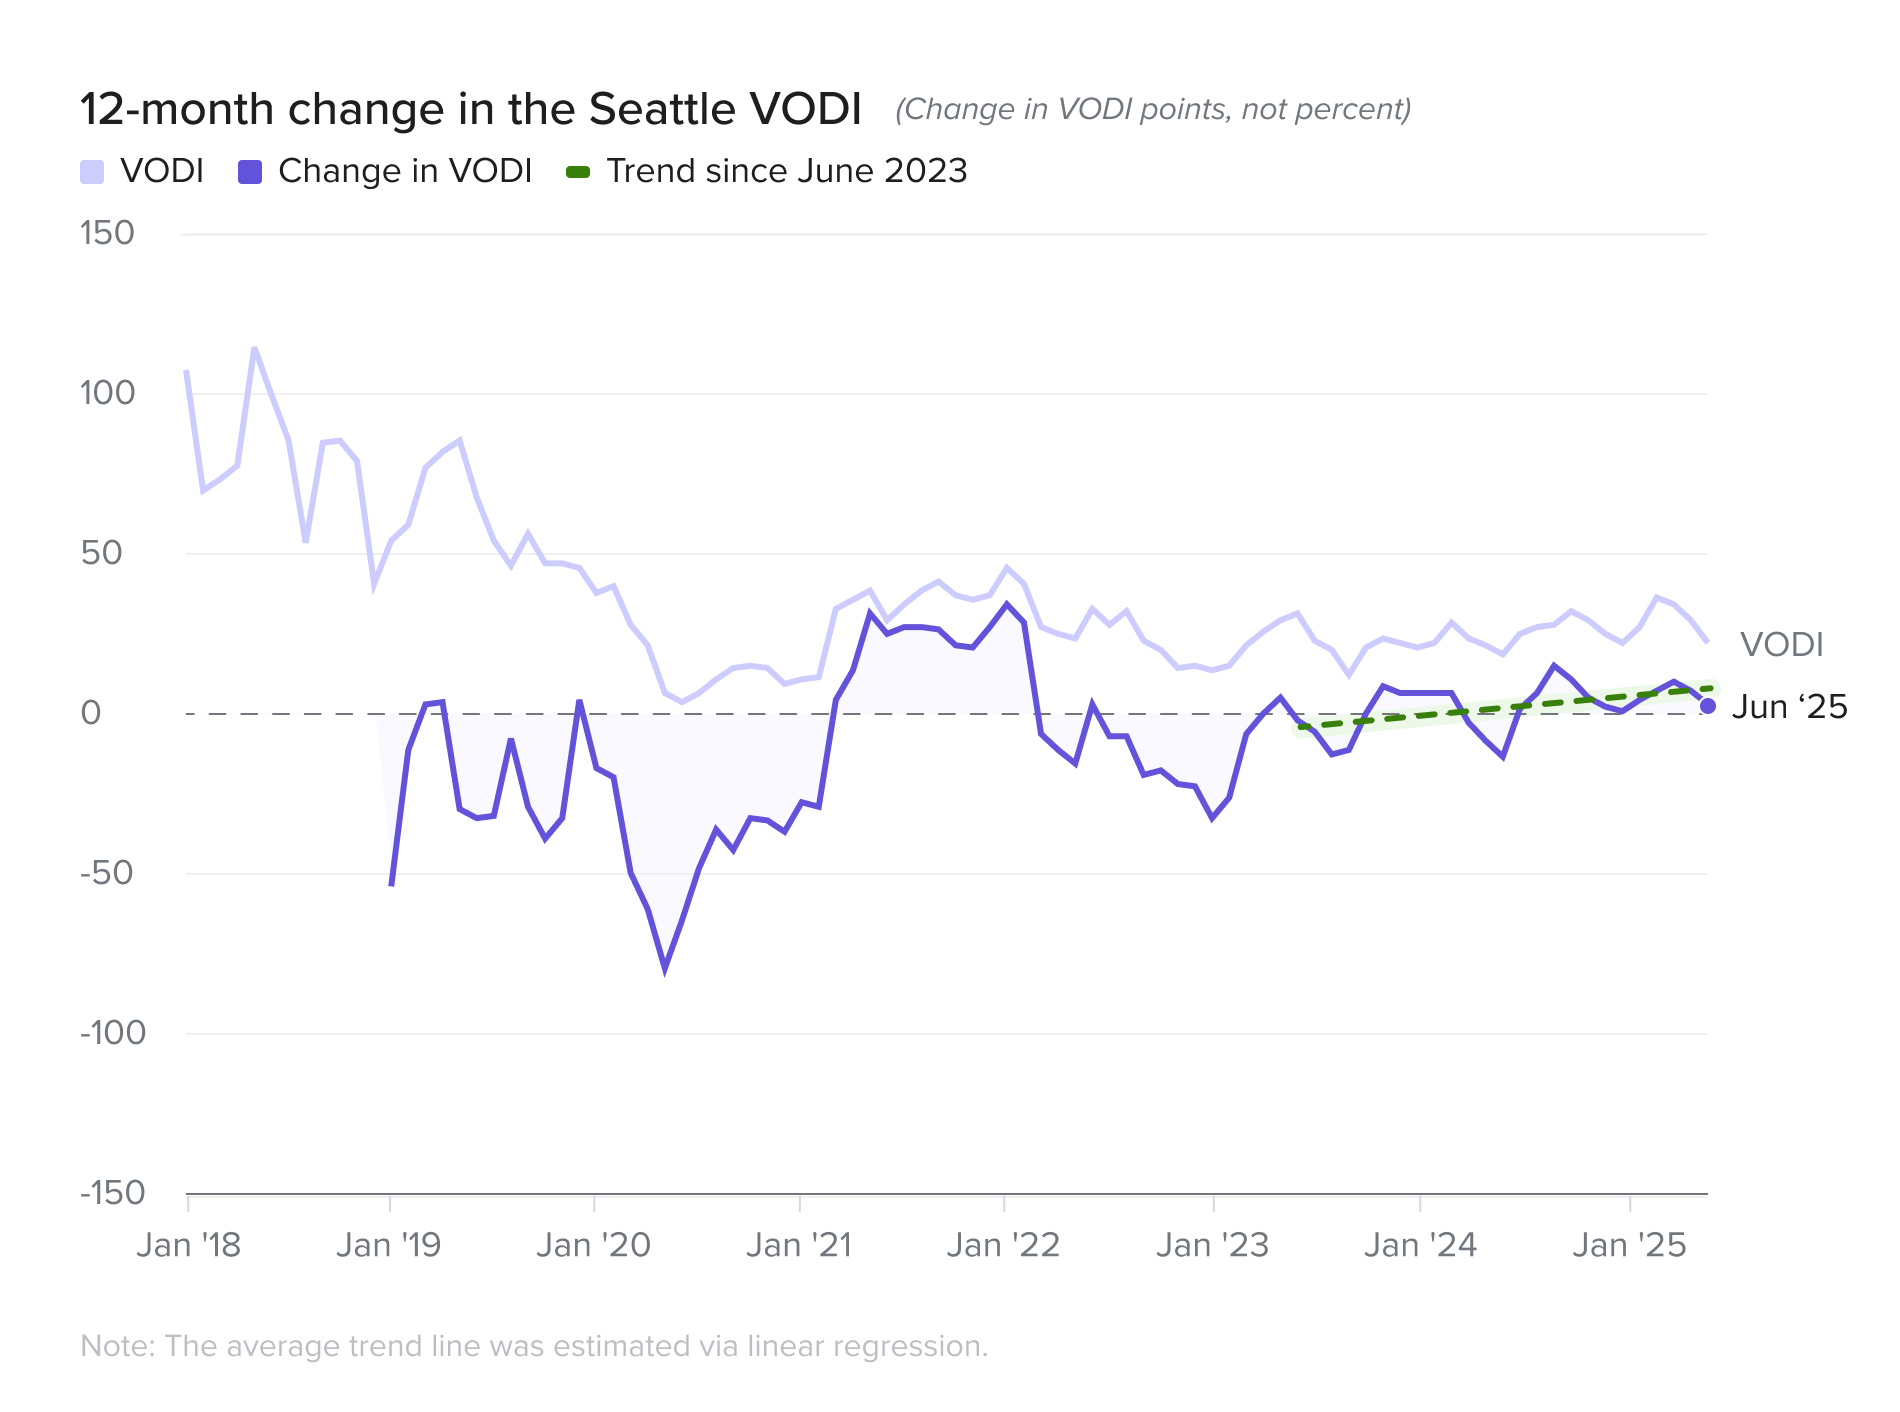
Seattle and New York City present a more mixed picture. Both posted healthy year-over-year gains of 18.5 percent and 17.7 percent but their quarterly performance diverged sharply.
New York City demand remained essentially unchanged in the aggregate in Q2, rising just 1.1 percent since March. Finance continues to be the largest demand contributor by volume, but quarterly demand from the sector was down 6 percent year-over-year. The Tech and Legal sectors have filled the gap, especially Tech - growing by double digits on a year-over-year and quarter-over-quarter basis.
Seattle's demand in contrast, cooled significantly, falling 38.5 percent versus March. It's important to highlight that the coverage for purposes of this report is based on demand metrics from the Downtown Seattle area. This is key - as the Seattle Metroeast market has garnered the Tech demand that has failed to show up in Central Seattle, by almost a factor of 2:1 in the last year. In comparison to the other major markets, such as San Francisco or Boston, it has failed to see a net new demand driver like AI and Life Science.
�
increase year-over-year
18.5%
Seattle and New York City

increase year-over-year
17.5%
SEATTLE
New york city
The surging markets
�
Markets in Focus
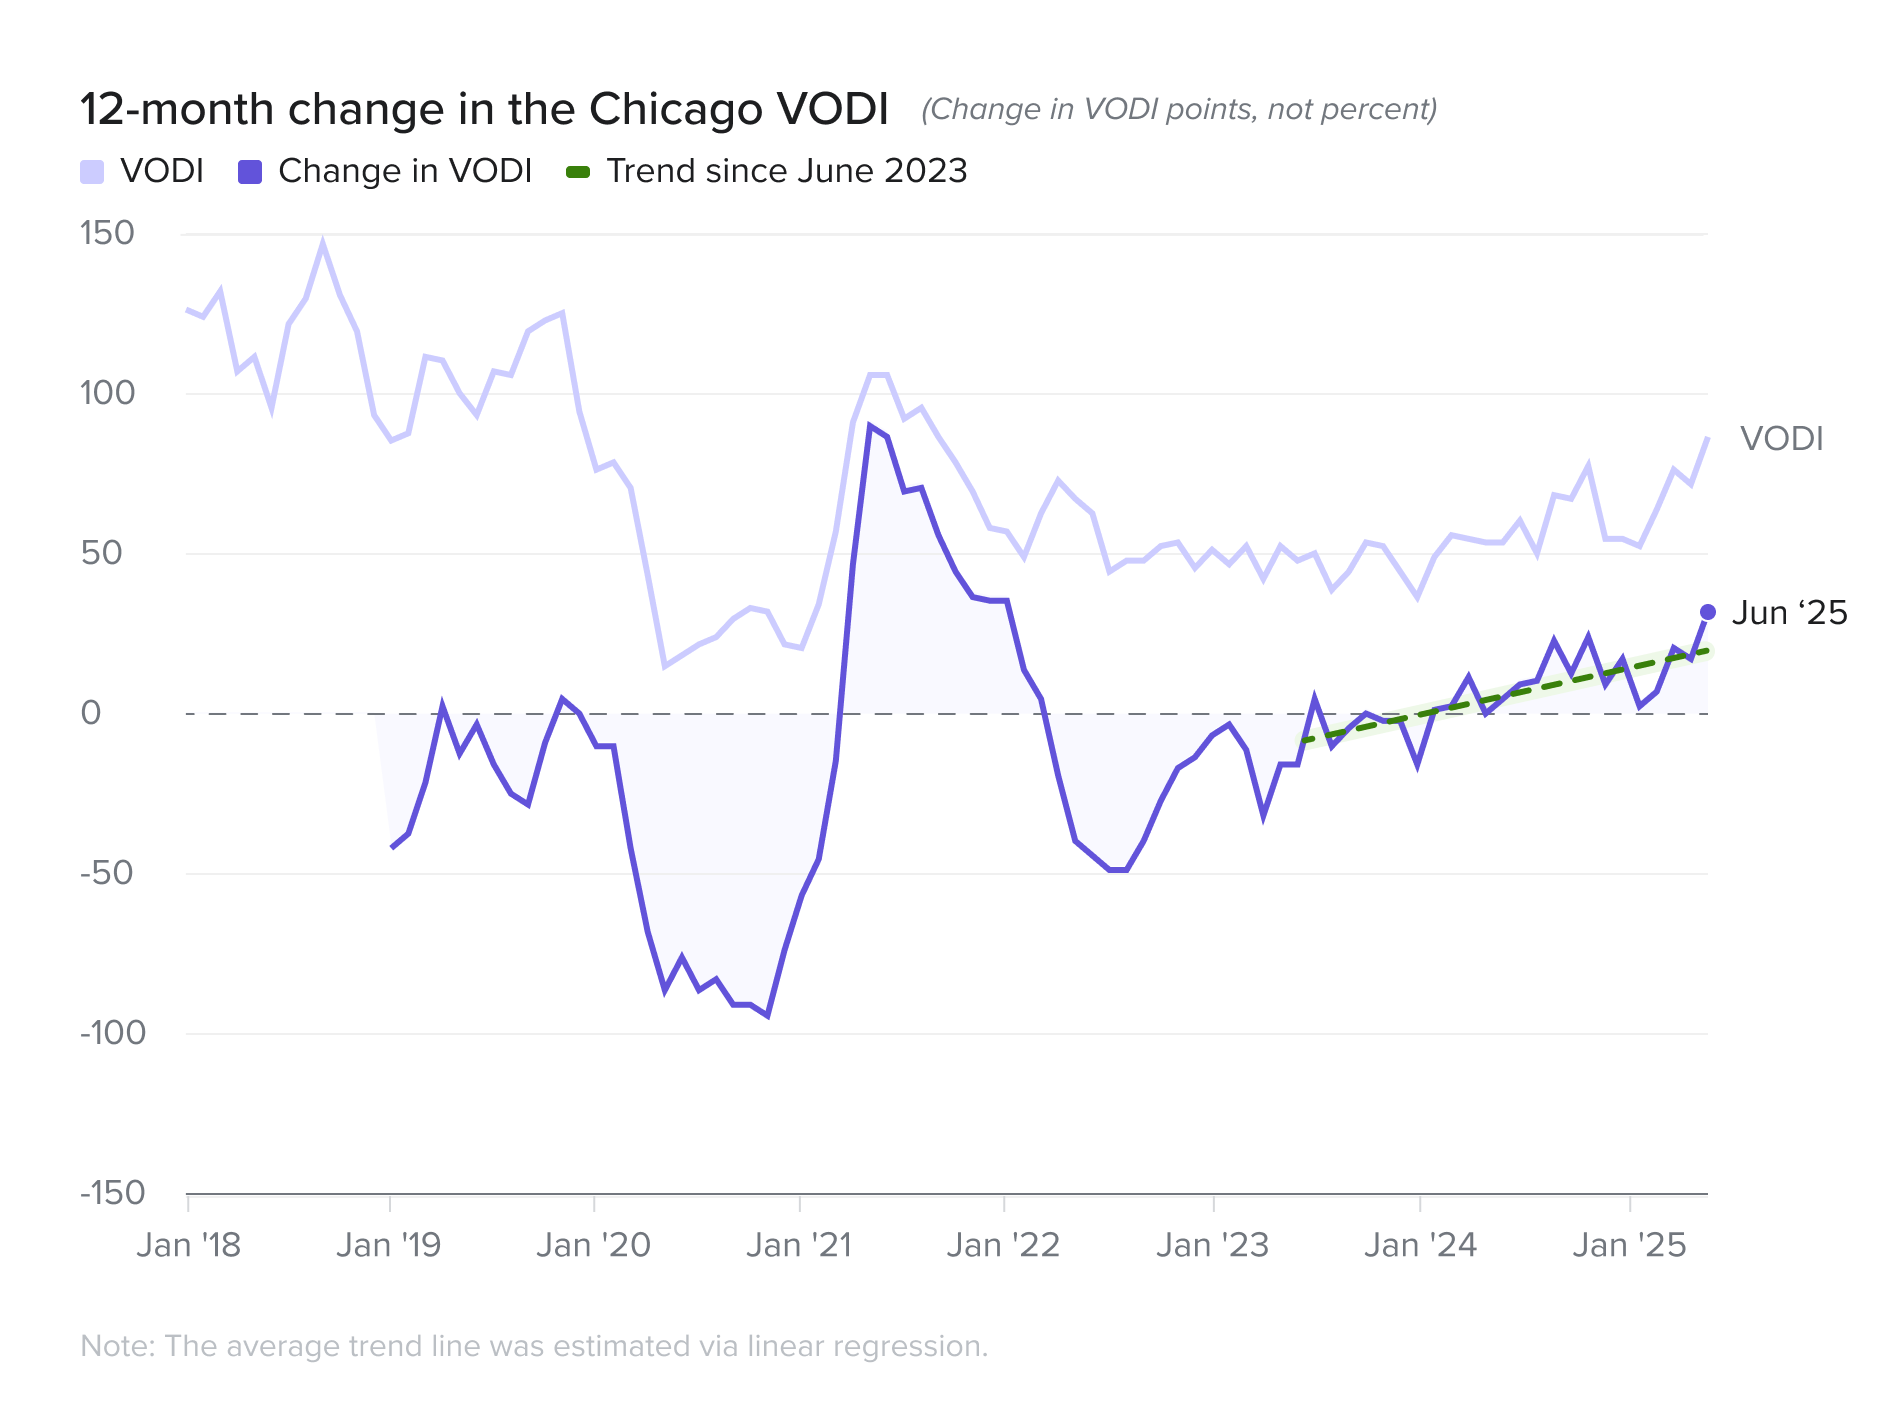
Chicago's VODI rocketed up 60.4 percent year-over-year and an impressive 35.1 percent since March led by the legal and finance sectors.
San Francisco also showed strong momentum, with its VODI rising 27.3 percent year-over-year and surging 40 percent since the end of Q1, fueled by a rebound in tech demand that continues to be led by the push in AI.
�
increase year-over-year
60.4%
increase year-over-year
27.3%
CHICAGO and SAN FRANCISCO
CHICAGO
SAN FRANCISCO
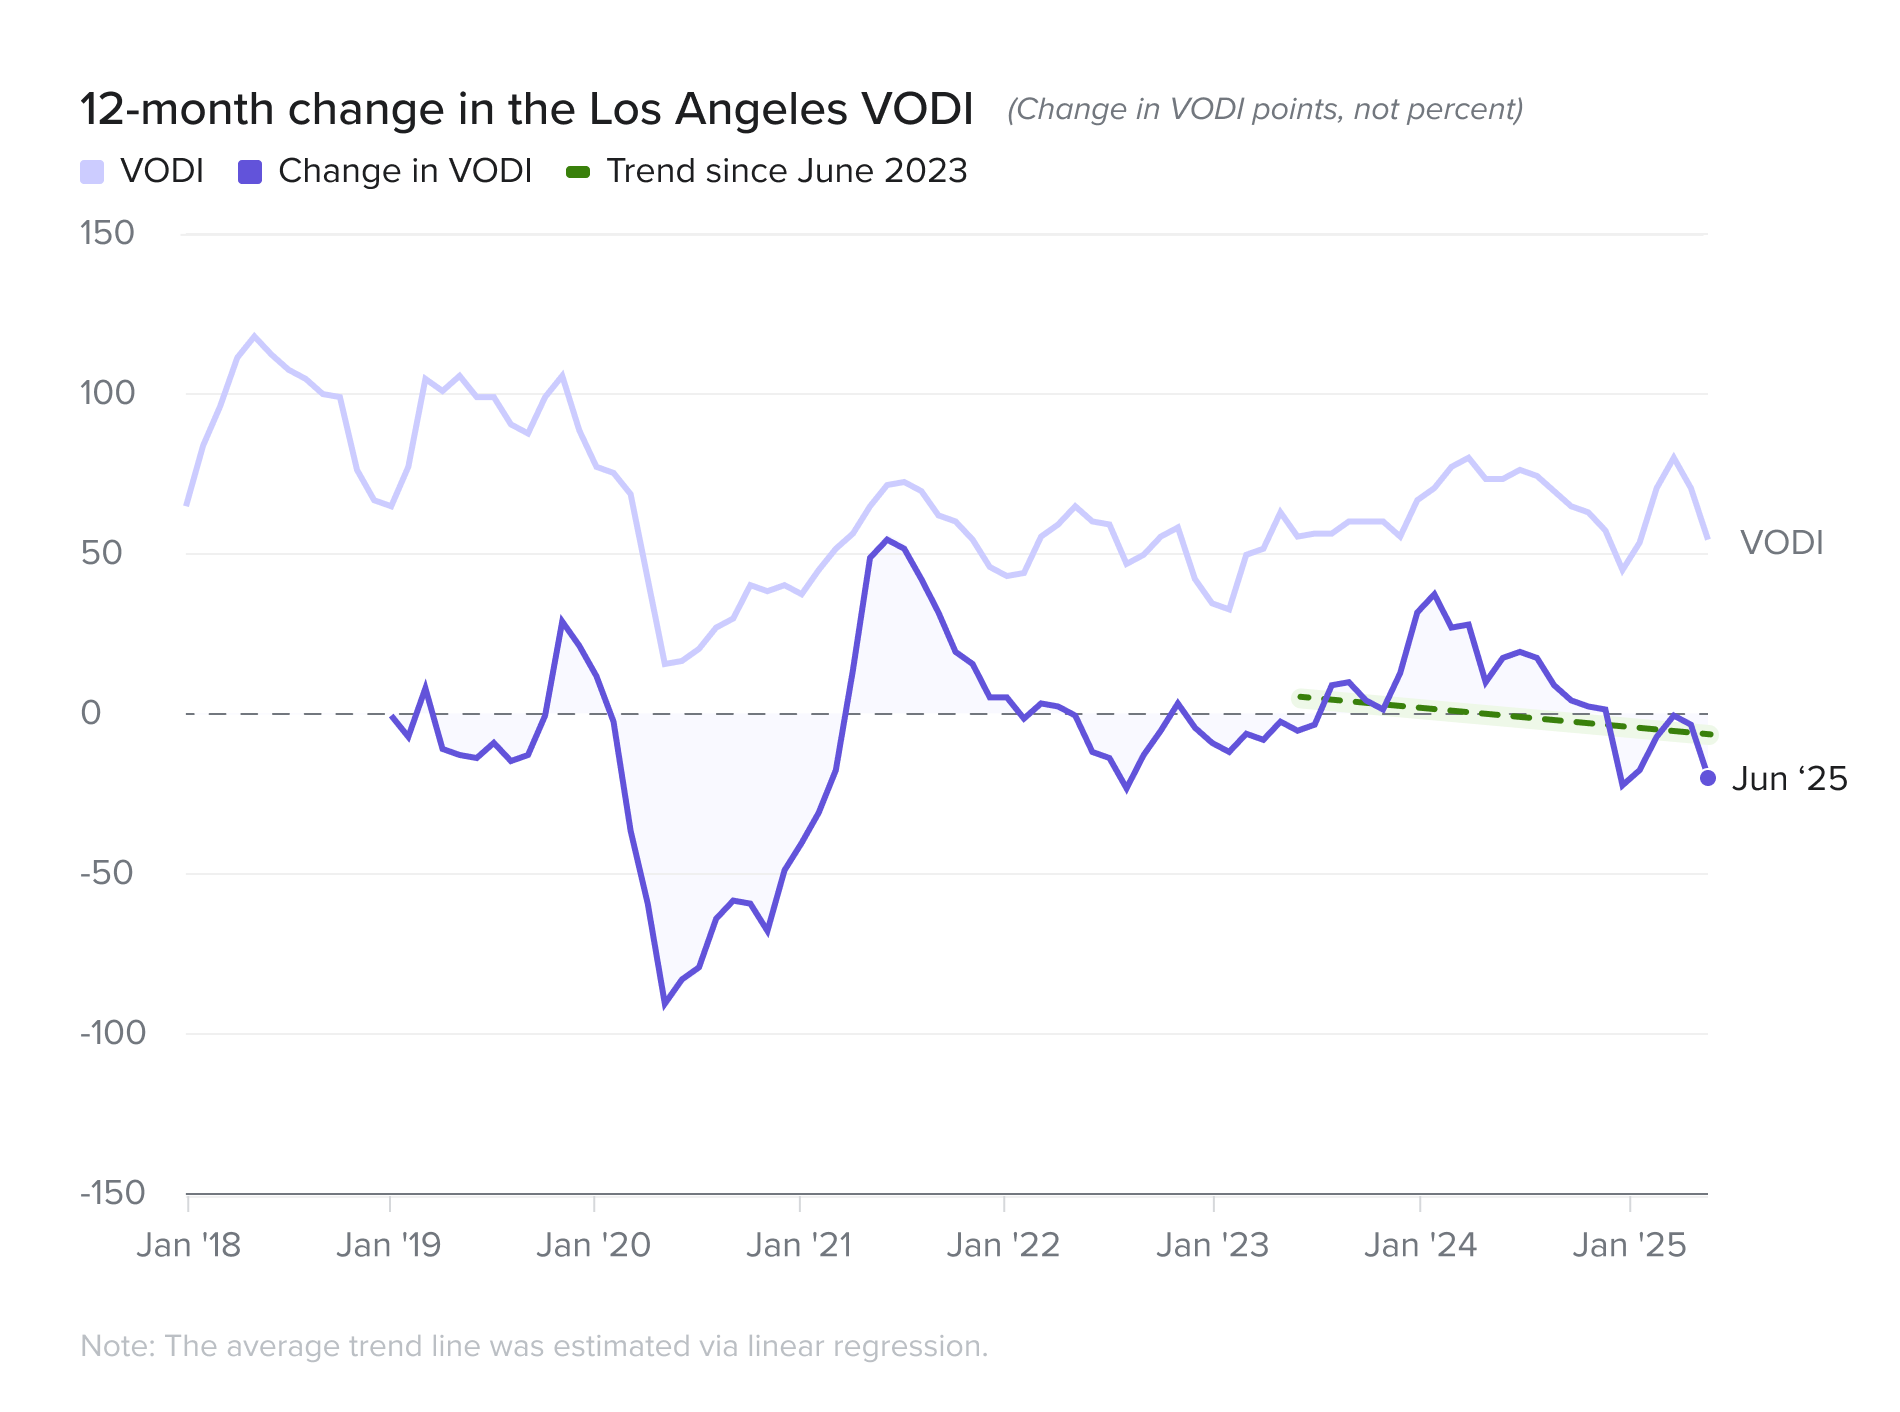
Los Angeles experienced the second sharpest year-over-year decline at 25.6 percent, a trend that continued in Q2 with a 22.7 percent drop since March.
Los Angeles’ poor performance is a result of many conflating factors - namely a streaming war that has cooled off leading to less office demand in the Creative sector, long-term lingering effects of the Entertainment industry strikes which has resulted in production companies looking to diversify its production locations and talent, natural disasters to start 2025, and the city has been ground zero for political demonstrations which have impacted office touring.
decline year-over-year
25.6%
Los angeles
The cooling coasts
�
Markets in Focus
Chicago and San Francisco were the standout leaders this quarter - both fueled by double digit gains in large-block tenant demand on a quarter-over-quarter and year-over year basis.
In a striking reversal of earlier post-pandemic recovery trends, other major coastal hubs saw demand recede sharply.
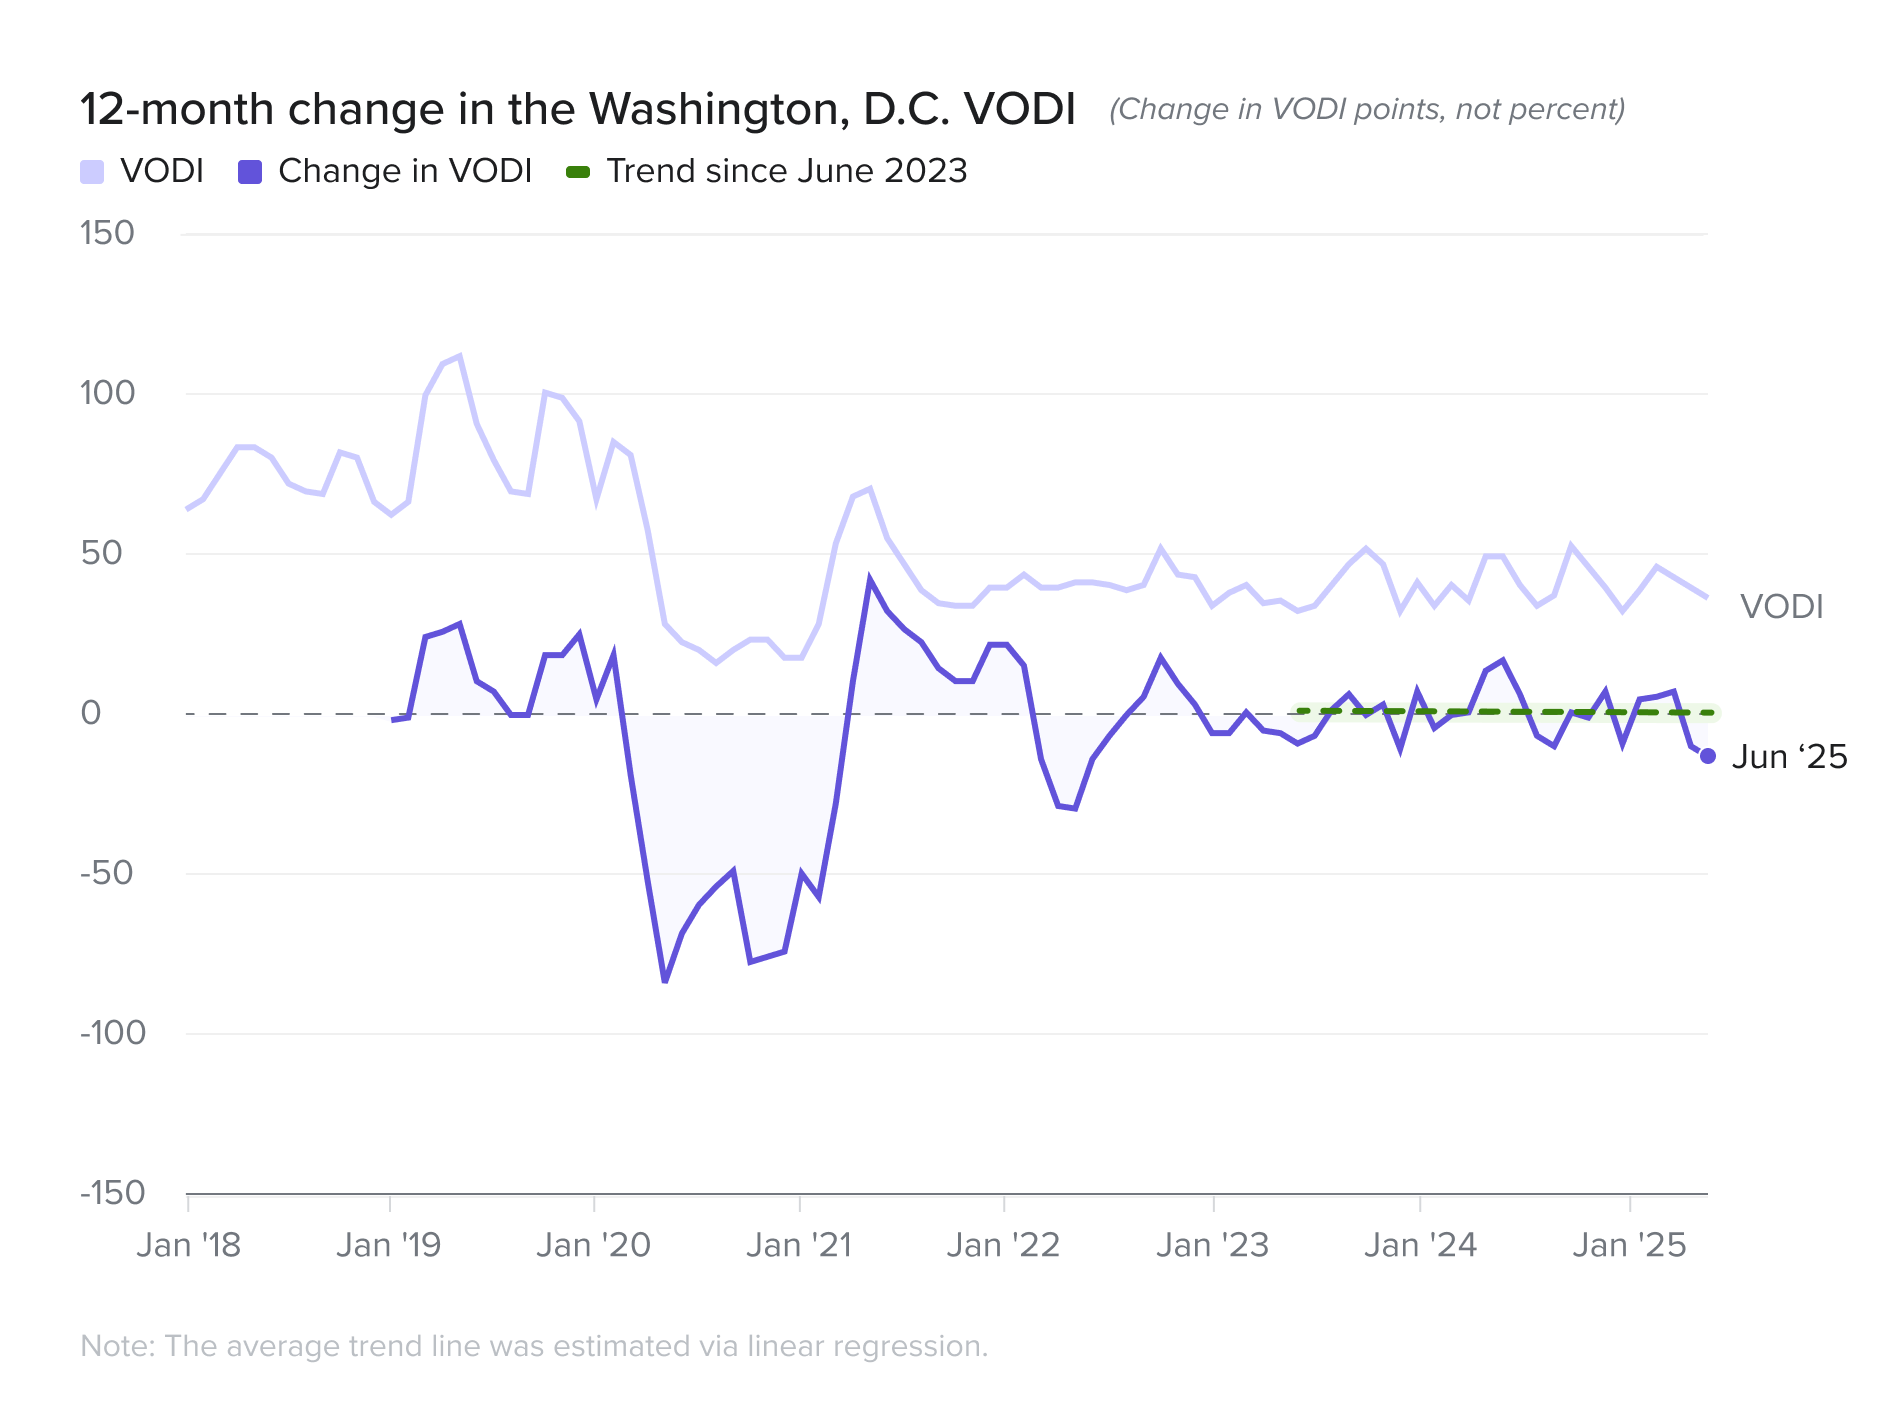
Washington, D.C. saw the sharpest year-over-year decline at 26.2 percent year-over-year and a 21.1 percent drop quarter-over-quarter.
While Washington, D.C.’s two main industry drivers, Association/Non-Profits and Legal, grew over the last quarter, every other industry sector saw limited or double digit declines in demand. Given the curtailing of spending and headcount in many federal departments, public sector demand and the industries that are correlated to it have few growth prospects at present time.
decline year-over-year
26.2%
Washington, d.c.
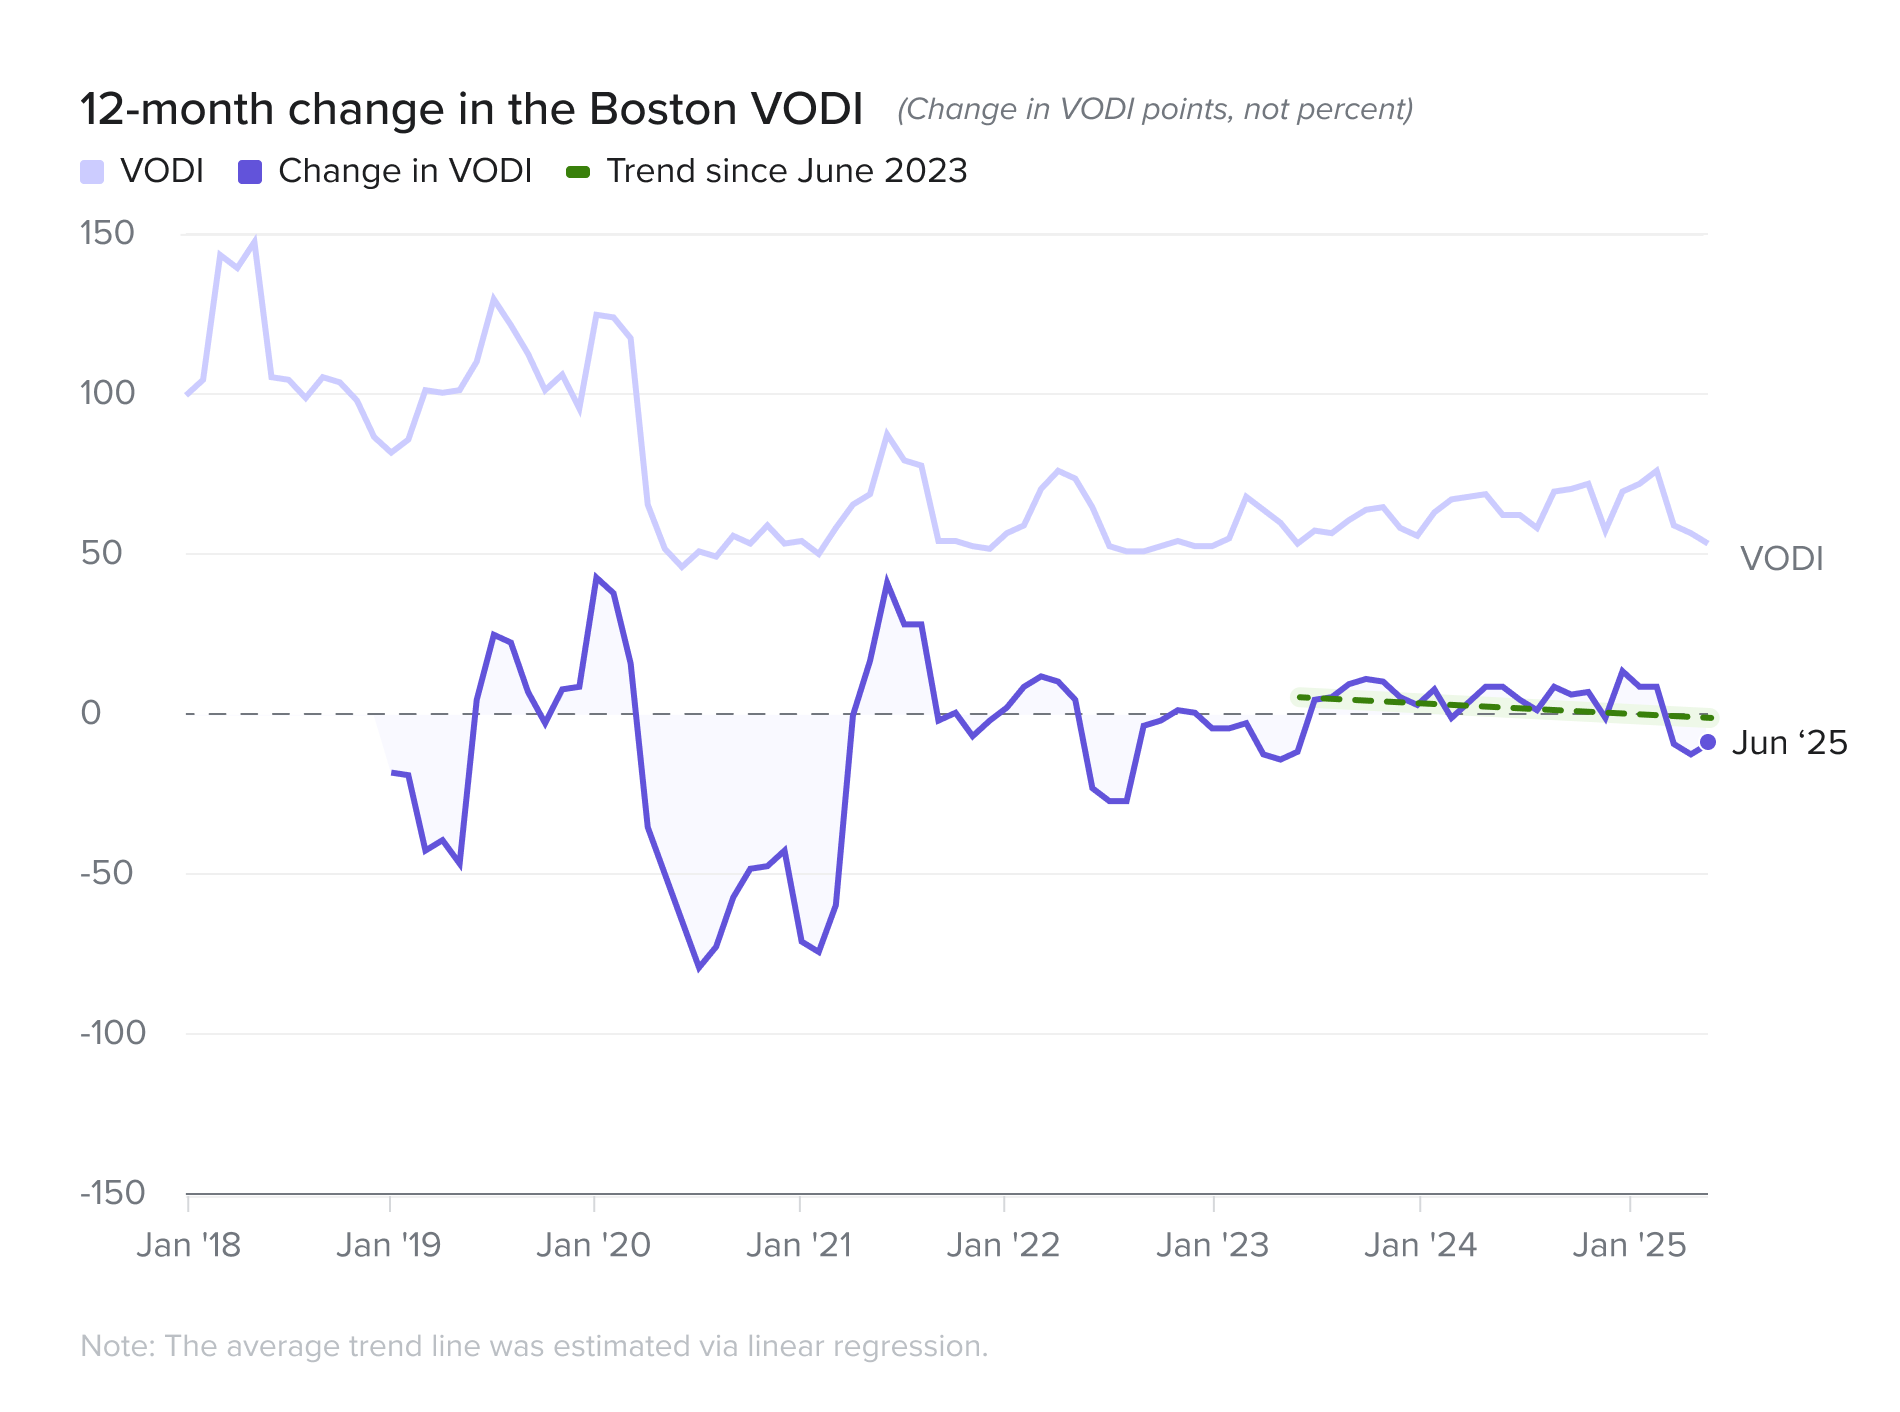
Lastly, Boston’s VODI fell 25.0 percent from its June 2024 level, but the quarterly picture is even more stark, with demand plummeting 45.9 percent.
Boston reversed course in Q2. After multiple quarters over the past year of new demand totaling 2M square feet or more, large tenants disappeared from the market and Boston had its worst quarter for demand in the post-pandemic period.
drop in quarterly demand
45.9%
Boston
12 month change in VODI
PREVIOUS
Markets that led the early post-pandemic recovery have cooled significantly. Washington, D.C. saw the largest year-over-year decline at 26.2 percent, and was also down 21.1 percent versus Q1. The declines in Los Angeles (-25.6 percent) and Boston (-25 percent) versus last year have also been followed by double-digit declines on a quarter-to-quarter basis.
NEXT
PREVIOUS
Tech-centric markets like San Francisco (+27.3 percent) and Seattle (+18.5 percent) showed strong year-over-year gains, but only San Francisco kept this momentum in Q2 where office demand increased by 40 percent versus Q1 thanks in large part to demand from AI. Seattle was much more volatile as this annual growth masks a significant quarterly 38.5 percent slowdown.
NEXT
PREVIOUS
Chicago was the standout leader, with its VODI surging 60.4 percent year-over-year and a remarkable 35.1 percent quarter-over-quarter, driven by large-block Tech demand and higher overall demand from Professional Services. While Chicago’s recent gains are substantial, it remains to be seen whether or not this represents a new paradigm or just a temporary boost by select larger tenants.
NEXT

Boston
Chicago
Los Angeles
New York
San Francisco
Seattle
Washington, D.C.


BOOK A DEMO

NEXT
NEXT
NEXT
NEXT
PREV
PREV
PREV
Chicago's VODI rocketed up 60.4 percent year-over-year and an impressive 35.1 percent since March led by the legal and finance sectors.
San Francisco also showed strong momentum, with its VODI rising 27.3 percent year-over-year and surging 40 percent since the end of Q1, fueled by a rebound in tech demand that continues to be led by the push in AI.
�
increase year-over-year
60.4%
CHICAGO
increase year-over-year
27.3%
SAN Francisco
Chicago AND San Franscisco
Chicago and San Francisco were the standout leaders this quarter - both fueled by double digit gains in large-block tenant demand on a quarter-over-quarter and year-over year basis.
The surging markets
�
Markets in Focus
Chicago's VODI rocketed up 60.4 percent year-over-year and an impressive 35.1 percent since March led by the legal and finance sectors.
San Francisco also showed strong momentum, with its VODI rising 27.3 percent year-over-year and surging 40 percent since the end of Q1, fueled by a rebound in tech demand that continues to be led by the push in AI.
�
increase year-over-year
60.4%
Chicago AND San Franscisco
Washington, D.C. saw the sharpest year-over-year decline at 26.2 percent year-over-year and a 21.1 percent drop quarter-over-quarter.
While Washington, D.C.’s two main industry drivers, Association/Non-Profits and Legal, grew over the last quarter, every other industry sector saw limited or double digit declines in demand. Given the curtailing of spending and headcount in many federal departments, public sector demand and the industries that are correlated to it have few growth prospects at present time.
decline year-over-year
26.2%
Washington, d.c.


Los Angeles experienced the second sharpest year-over-year decline at 25.6 percent, a trend that continued in Q2 with a 22.7 percent drop since March.
Los Angeles’ poor performance is a result of many conflating factors - namely a streaming war that has cooled off leading to less office demand in the Creative sector, long-term lingering effects of the Entertainment industry strikes which has resulted in production companies looking to diversify its production locations and talent, natural disasters to start 2025, and the city has been ground zero for political demonstrations which have impacted office touring.
decline year-over-year
25.6%
Los angeles
The VTS Office Demand Index (VODI) report is a free public-facing analysis based on VTS Data from the previous quarter, capturing office demand in the nation's seven gateway markets. Our VTS Data product includes comprehensive in-depth analytics of numerous benchmarks in over 30 markets across the U.S., the U.K., and Canada. For more information on what VTS Data can provide you, please connect with our team below.
BOOK A DEMO
NEXT
NEXT
NEXT
NEXT
PREV
PREV
PREV
The "push and pull" between employers and employees over remote work saw a surprising slight reversal in the second quarter. After a three year decline, the share of job searches for remote work increased from 6.7 percent to 7.8 percent during the second quarter - the third highest quarterly increase - only behind the increases in Q3 2021 and Q1 2020. This implies employer leverage in the push for a return-to-office is more nuanced and less linear than is commonly thought.


increase year-over-year
60.4%
Chicago AND San Franscisco
Chicago's VODI rocketed up 60.4 percent year-over-year and an impressive 35.1 percent since March led by the legal and finance sectors.
San Francisco also showed strong momentum, with its VODI rising 27.3 percent year-over-year and surging 40 percent since the end of Q1, fueled by a rebound in tech demand that continues to be led by the push in AI.
The second quarter of 2025 revealed a dramatic divergence in the performance of major U.S. office markets. While the year-over-year picture shows clear winners and losers, a quarter-over-quarter analysis reveals significant volatility, with some markets experiencing a steep quarterly deceleration.
increase year-over-year
60.4%
CHICAGO
increase year-over-year
27.3%
SAN Francisco
Chicago AND San Franscisco
Chicago and San Francisco were the standout leaders this quarter - both fueled by double digit gains in large-block tenant demand on a quarter-over-quarter and year-over year basis.
Chicago's VODI rocketed up 60.4 percent year-over-year and an impressive 35.1 percent since March led by the legal and finance sectors.
San Francisco also showed strong momentum, with its VODI rising 27.3 percent year-over-year and surging 40 percent since the end of Q1, fueled by a rebound in tech demand that continues to be led by the push in AI.
increase year-over-year
18.5%
SEATTLE
increase year-over-year
17.5%
New york city
Seattle and New York City
Seattle and New York City present a more mixed picture. Both posted healthy year-over-year gains of 18.5 percent and 17.7 percent but their quarterly performance diverged sharply.
New York City demand remained essentially unchanged in the aggregate in Q2, rising just 1.1 percent since March. Finance continues to be the largest demand contributor by volume, but quarterly demand from the sector was down 6 percent year-over-year. The Tech and Legal sectors have filled the gap, especially Tech - growing by double digits on a year-over-year and quarter-over-quarter basis.
Seattle's demand in contrast, cooled significantly, falling 38.5 percent versus March. It's important to highlight that the coverage for purposes of this report is based on demand metrics from the Downtown Seattle area. This is key - as the Seattle Metroeast market has garnered the Tech demand that has failed to show up in Central Seattle, by almost a factor of 2:1 in the last year. In comparison to the other major markets, such as San Francisco or Boston, it has failed to see a net new demand driver like AI and Life Science.
�
The surging markets�
Markets in Focus
decline year-over-year
26.2%
Washington, d.c.
Washington, D.C. saw the sharpest year-over-year decline at 26.2 percent year-over-year and a 21.1 percent drop quarter-over-quarter.
While Washington, D.C.’s two main industry drivers, Association/Non-Profits and Legal, grew over the last quarter, every other industry sector saw limited or double digit declines in demand. Given the curtailing of spending and headcount in many federal departments, public sector demand and the industries that are correlated to it have few growth prospects at present time.
decline year-over-year
25.6%
Los angeles
Los Angeles experienced the second sharpest year-over-year decline at 25.6 percent, a trend that continued in Q2 with a 22.7 percent drop since March.
Los Angeles’ poor performance is a result of many conflating factors - namely a streaming war that has cooled off leading to less office demand in the Creative sector, long-term lingering effects of the Entertainment industry strikes which has resulted in production companies looking to diversify its production locations and talent, natural disasters to start 2025, and the city has been ground zero for political demonstrations which have impacted office touring.
Boston
Chicago
Los Angeles
New York
San Francisco
Seattle
Washington, D.C.
Boston
Chicago
Los Angeles
New York
San Francisco
Seattle
Lastly, Boston’s VODI fell 25.0 percent from its June 2024 level, but the quarterly picture is even more stark, with demand plummeting 45.9 percent.
Boston reversed course in Q2. After multiple quarters over the past year of new demand totaling 2M square feet or more, large tenants disappeared from the market and Boston had its worst quarter for demand in the post-pandemic period.
Headline office demand growth was stable in Q2 2025, masking underlying volatility across markets. The National VTS Office Demand Index (VODI) ended June at a level of 70, 11.1 percent higher than the VODI of 63 recorded in June 2024. The index was flat quarter-over-quarter, down 1.4 percent from 71 in March 2025, as uncertainty abounded from a changing landscape in global trade policy, geopolitical escalations, and as office-using firms try to establish the short- and long-term impacts of AI on productivity and the workforce.


